Peripheral Blood Mononuclear Cells with 8 Antibodies
Dataset: Cell hashing
Stoeckius, M., Zheng, S., Houck-Loomis, B., Hao, S., Yeung, B.Z., Mauck, W.M., 3rd, Smibert, P., and Satija, R. (2018). Cell Hashing with barcoded antibodies enables multiplexing and doublet detection for single cell genomics. Genome Biol. 19, 224.
Preparation
Download fastq files from European Nucleotide Archive.
$ wget ftp.sra.ebi.ac.uk/vol1/fastq/SRR828/007/SRR8281307/SRR8281307_1.fastq.gz

$ wget ftp.sra.ebi.ac.uk/vol1/fastq/SRR828/007/SRR8281307/SRR8281307_2.fastq.gz
Download cell barcode info.
These are the cell-associated barcodes in this single cell RNA-Seq library (determined by the number of transcriptomic UMIs captured per barcode).
$ curl -O https://ftp.ncbi.nlm.nih.gov/geo/samples/GSM2895nnn/GSM2895283/suppl/GSM2895283_Hashtag-HTO-count.csv.gz

$ gzip -dc GSM2895283_Hashtag-HTO-count.csv.gz | head -1 | sed 's/,/\n/g' | grep -v '^$' > cell_barcodes.txt
Inspect cell barcodes.
$ head cell_barcodes.txt

GGCGACTAGAGGACGG
CATCAAGGTCTTGTCC
AAACCTGAGTGATCGG
TGAGGGAGTACTTAGC
CCTAAAGAGATGTGGC
AGACGTTTCAGCCTAA
TGGGAAGCAACACCCG
CGATTGATCTTCGGTC
CATCGAAGTGATGCCC
TCAGATGCACGAGAGT
Prepare feature barcodes (hashtag-oligos, HTO).
$ gzip -dc GSM2895283_Hashtag-HTO-count.csv.gz | cut -d ',' -f1 | grep Batch | gsed 's/-/\t/g' > feature_barcodes.tsv
Inspect feature barcodes.
$ cat feature_barcodes.tsv

BatchA  AGGACCATCCAA
BatchB  ACATGTTACCGT
BatchC  AGCTTACTATCC
BatchD  TCGATAATGCGA
BatchE  GAGGCTGAGCTA
BatchF  GTGTGACGTATT
BatchG  ACTGTCTAACGG
BatchH  TATCACATCGGT
QC
The first 20,000 read pairs are sampled (default 100,000, set by
-n, ) for quality control. The -t option can be used to set the
number of threads. By default, diagnostic results and plots are
generated in the qc directory (set by --output_directory), and
the full length of read 1 and read 2 are searched against reference cell
and feature barcodes, respectively. The per base content of both read
pairs and the distribution of matched barcode positions are summarized.
Use -r1_c and/or -r2_c to limit the search range, and -cb_n
and/or -fb_n to set the mismatch tolerance for cell and/or feature
barcode matching (default 3).
$ fba qc \
    -1 SRR8281307_1.fastq.gz \
    -2 SRR8281307_2.fastq.gz \
    -w cell_barcodes.txt \
    -f feature_barcodes.tsv \
    --output_directory qc \
    -n 20000
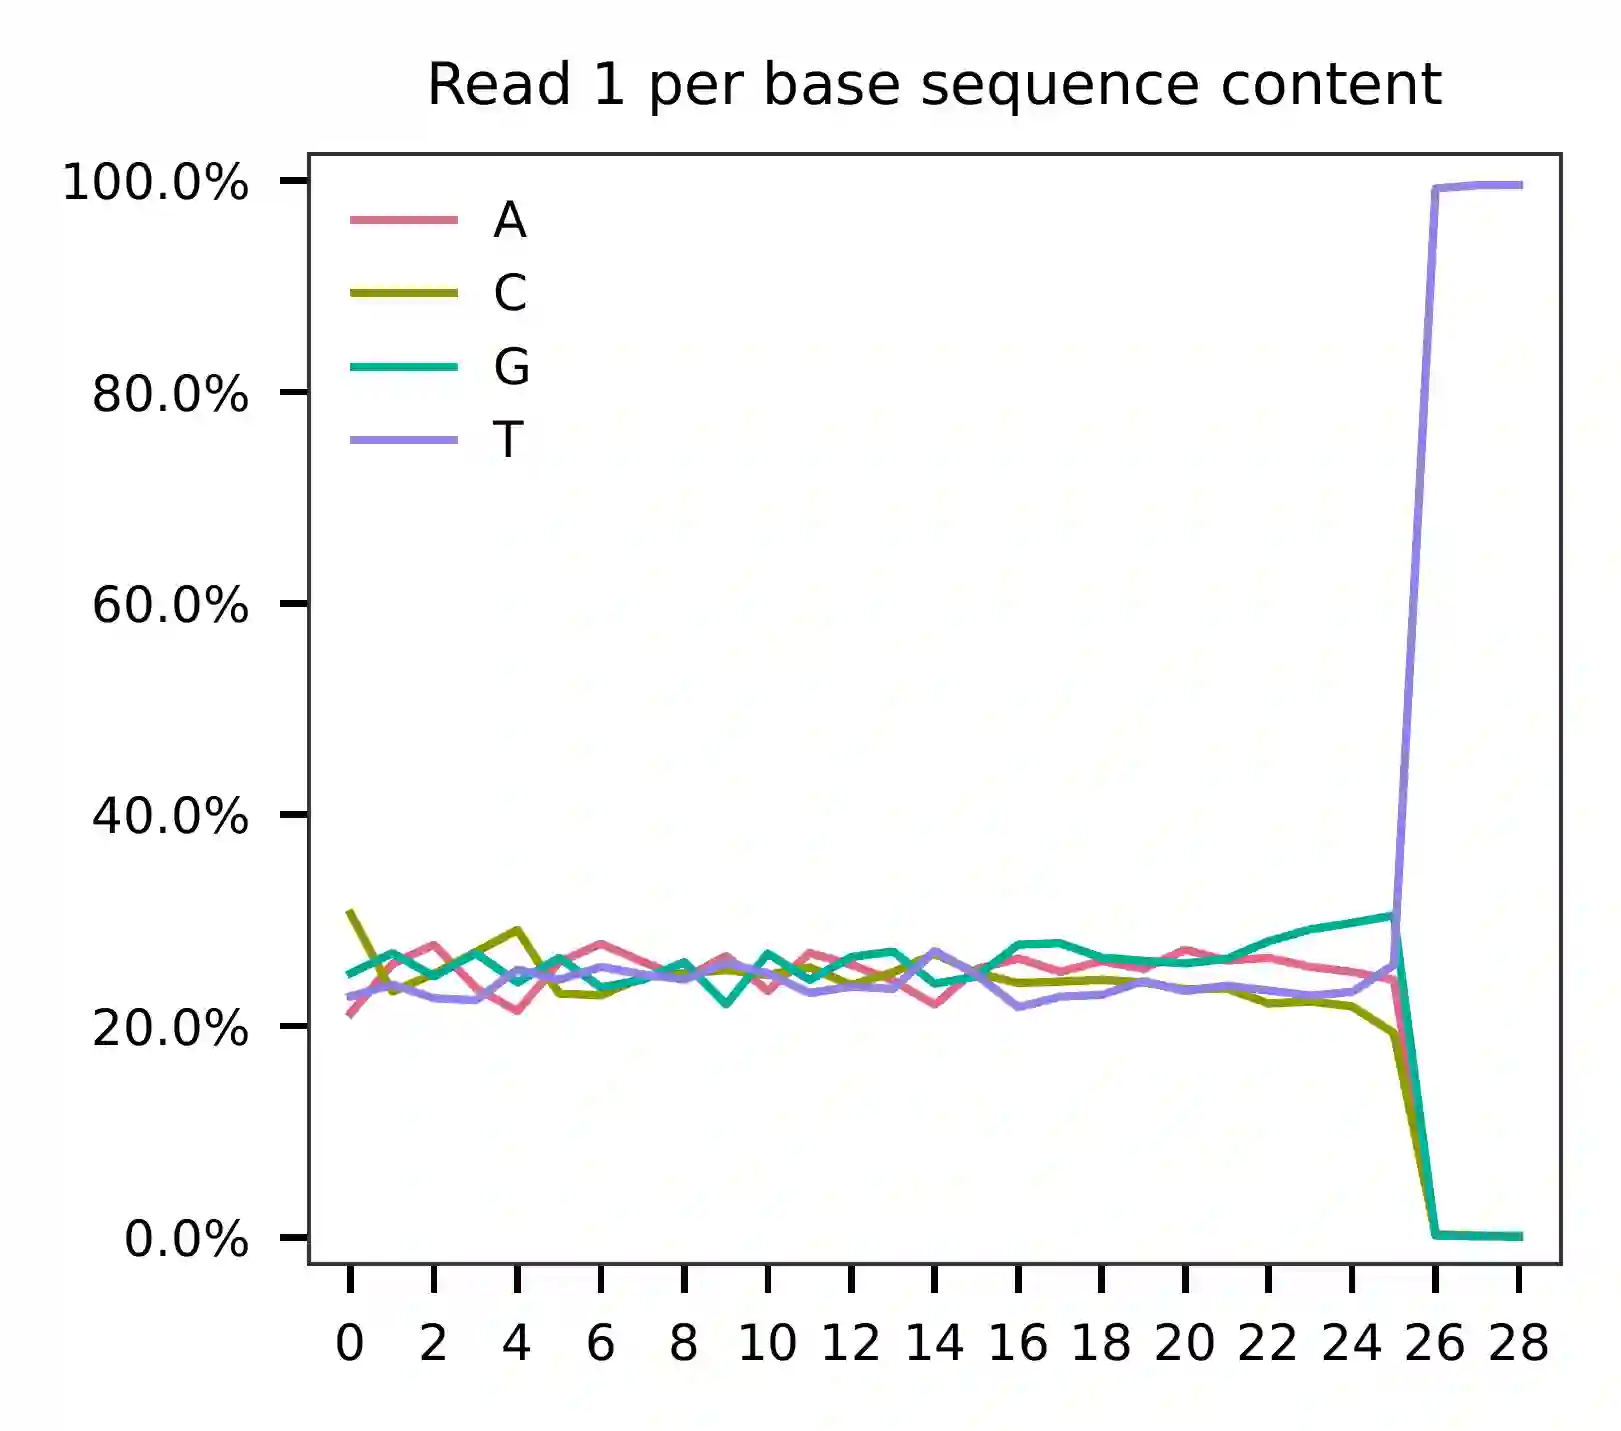
This library was constructed using Chromium Single Cell 3’ Reagent Kits (v2 Chemistry). The first 16 bases correspond to cell barcodes and the following 10 bases correspond to UMIs on read 1. Based on the base content plot, both the cell barcode and UMI sequences exhibit even GC content. A poly-A tail starts at base 26.
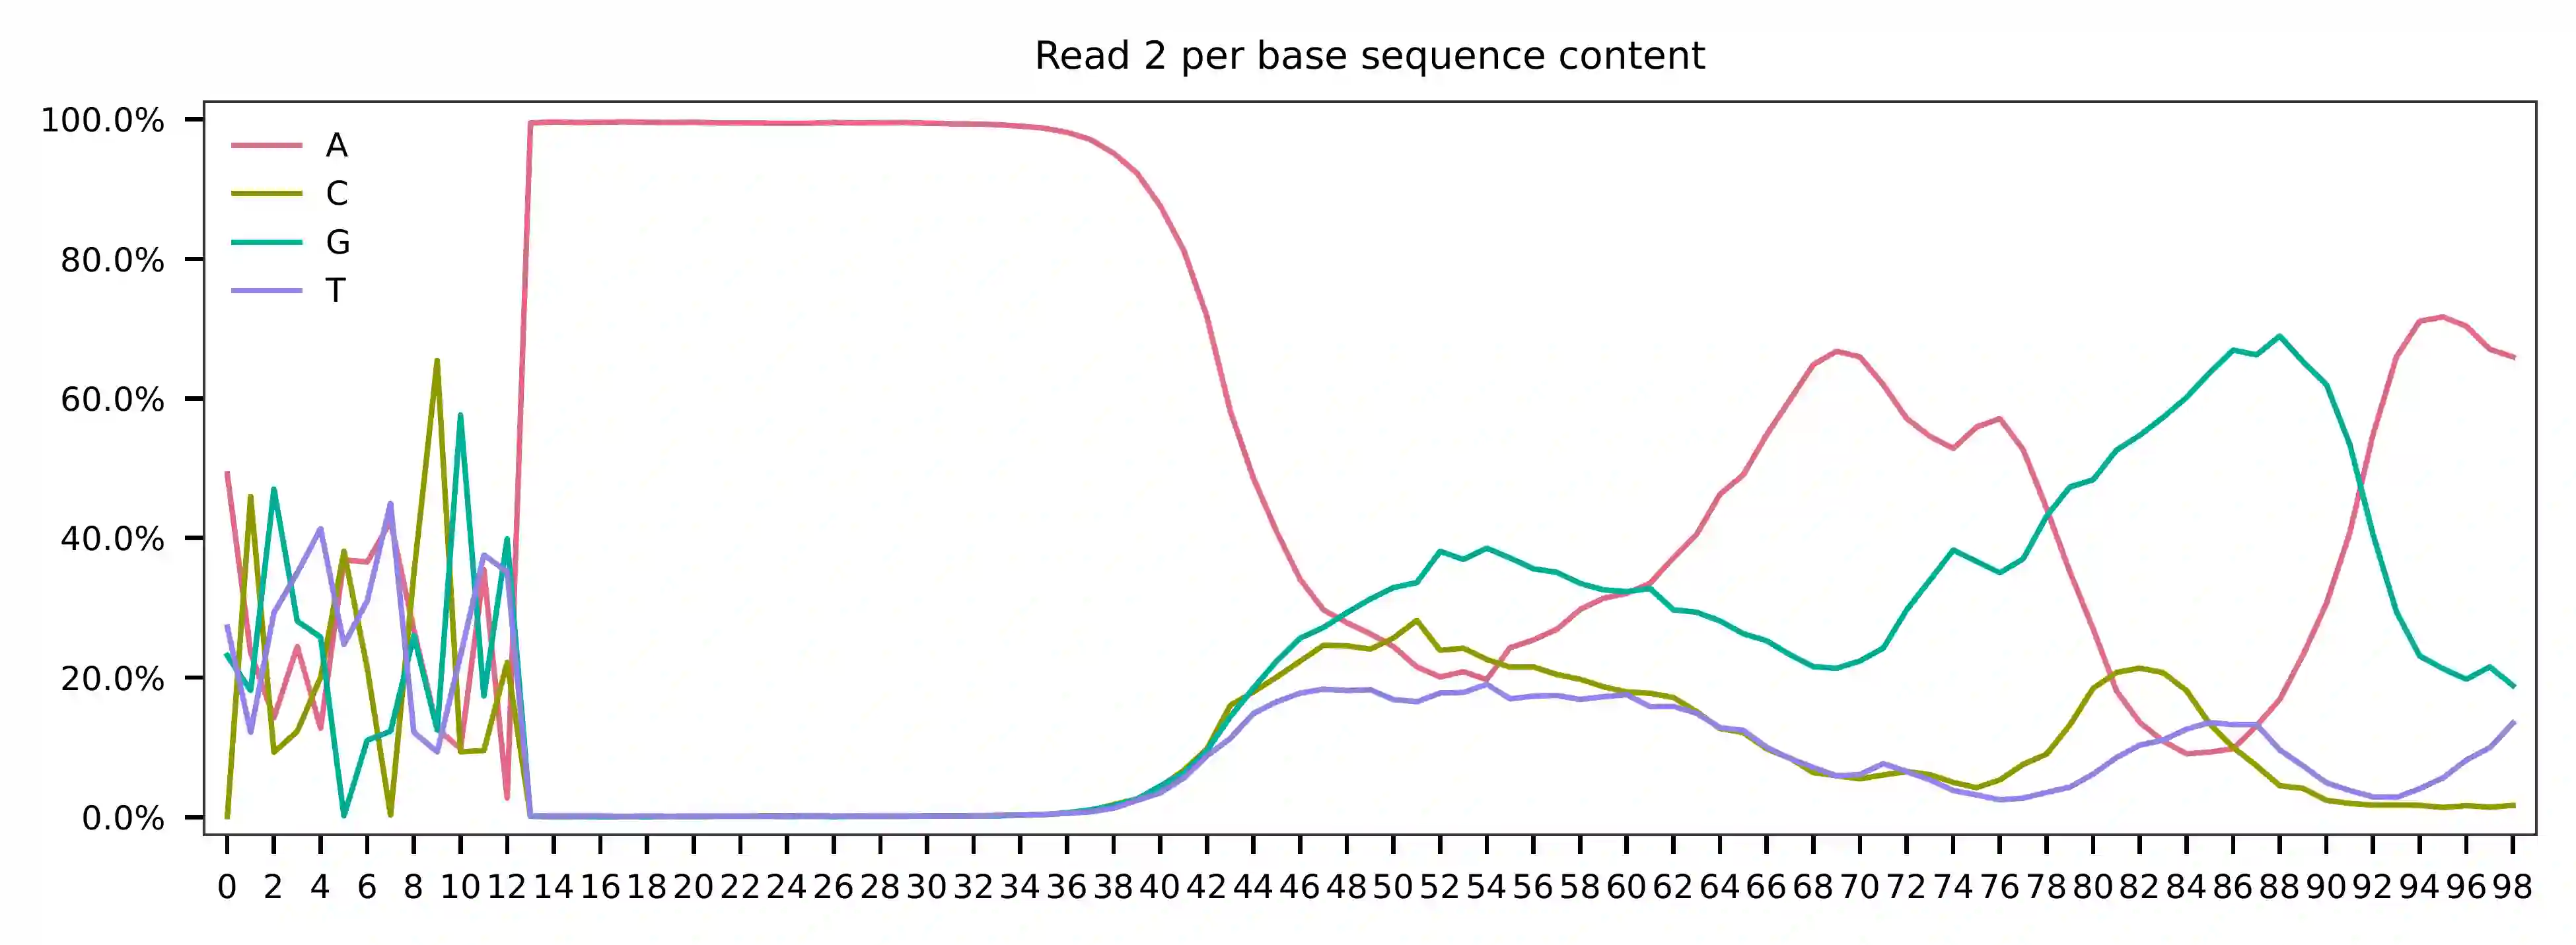
As for read 2, based on the per base content, it suggests that bases 0-11 exhibit relatively balanced GC content for the reads that we have sampled. Starting from base 12, there is a poly-A tail. Bases 0-11 are hashtag oligo sequences, and the majority of the reads appear to have the expected structure.
The detailed qc results are stored in
feature_barcoding_output.tsv.gz file. matching_pos columns
indicate the matched positions on reads. matching_description
columns indicate mismatches in substitutions:insertions:deletions
format.
$ gzip -dc qc/feature_barcoding_output.tsv.gz | head

read1_seq       cell_barcode    cb_matching_pos cb_matching_description read2_seq       feature_barcode fb_matching_pos fb_matching_description
NTCCGAACATATGAGAGCAATAGTCGTTT   CGAACATGTAAGAGAG        3:17    1:0:2   NCATGTTACCGTGAAAAAAAAAAAAAAAAAAAAAAAAAAAAAAAAACAGCAATTGTCACTTATAGGAGGAGAAGAAGGGAAGGGGGGGGGGGGGGGAAA     BatchB_ACATGTTACCGT     0:12    1:0:0
NAACGGATCCACGAATGAAGGACGCCTTT   TACGGTATCCACGAAT        1:16    1:0:1   NNGNNAATGCGAGAAAAAAAAAAAAAAAAAAAAAAAAAAAAGGGGCGCTCTCTTCGGGGGGGCGGGGAGAGCGAAGGAGGGGGGGGGGGGGGGAAGGAG     no_match        NA      NA
NGGCCAGTCTTCAACTGTTAACACTATTT   GTCCTCAAGCTGTCTA        6:20    1:0:2   NNNNNNNNNNNNNAAANNAAAAAAAAAAAAAAAAAAAAAAAAAAAAAAGGTTTAAAAAGTGAAAGAGGGACAAAACGGGAAAAACGGGGGTGGGGAAAA     no_match        NA      NA
NATCCAGCAATACGCTTTCCACGACATTT   ATCCACCCATACGCTA        1:17    3:0:0   NNNNNNNNNNNNNAAANNAAAAAAAAAAAAAAAAAAAAAGTGGGGGGAAAGCGGTTTTGGGAGATAAAACGAAAAAGCGGCGGGGGGGGAAAAAGGTGA     no_match        NA      NA
NTGCGATAGACACTAAGAGGAGTTCATTT   CGCGGTAAGACACTAA        1:16    2:0:1   NCGATAATGCGACAAAAAAAAAAAAAAAAAAAAAAAAAAAAAAAAAAAACCCCCTTTGTTTTTATCGTAAAGATGGGAAGGGGGCGGTGGAGGGAAAAA     BatchD_TCGATAATGCGA     0:12    1:0:0
NTGATCCAGAAGGTGAGGGAGGCTGATTT   AGATTGCGTGAGGGAG        7:21    1:0:2   NNNNNNNNNNNNNNAANNAAAAAAAAAAAAAAAAAATCACCCCCCCCCCCCTTTTGGTTCAAAAACGGAAAAAGCGCCGCGGGGGGAAAGAGTGTAAAT     no_match        NA      NA
NTGGGTCAGGCCGAATTGAAGGGATGTTT   GAAATGAAGTGAAGTT        12:28   3:0:0   NNNNNNCTATCCAAAANNAAAAAAAAAAAAAAAAAAAAAAAAAAAAAAACCCCTTCAATTGGCCCAGACCCAACACTCGAAGGGCCGGCTGGCAGCAAA     no_match        NA      NA
NGAGAAGTCTCGATGAATCTAGCCGCTTT   CGATTGAAGCTAGCCC        10:25   2:0:1   NNNNNNNNNCTNCAAANNAAAAAAAAAAAAAAATAAAAAAAACGGGCTGATCCCAAGCAGACGTCACAAAGAAGCGAGAGAGTGGGATTGAGAAAAAGA     no_match        NA      NA
NCACGGAGTTCCCTTGCCAATGTAGTTTT   AGGGAGTTCGTTTGCC        2:18    3:0:0   NGCTTACTATCCTAAAAAAAAAAAAAAAAAAAAAAAAAAAAAAAAATATGGGGGGGGGGAATCGGGGGGGAGGGGAAAGGGGGGGTGGGGGAAAAAAGA     BatchC_AGCTTACTATCC     0:12    1:0:0
Barcode extraction
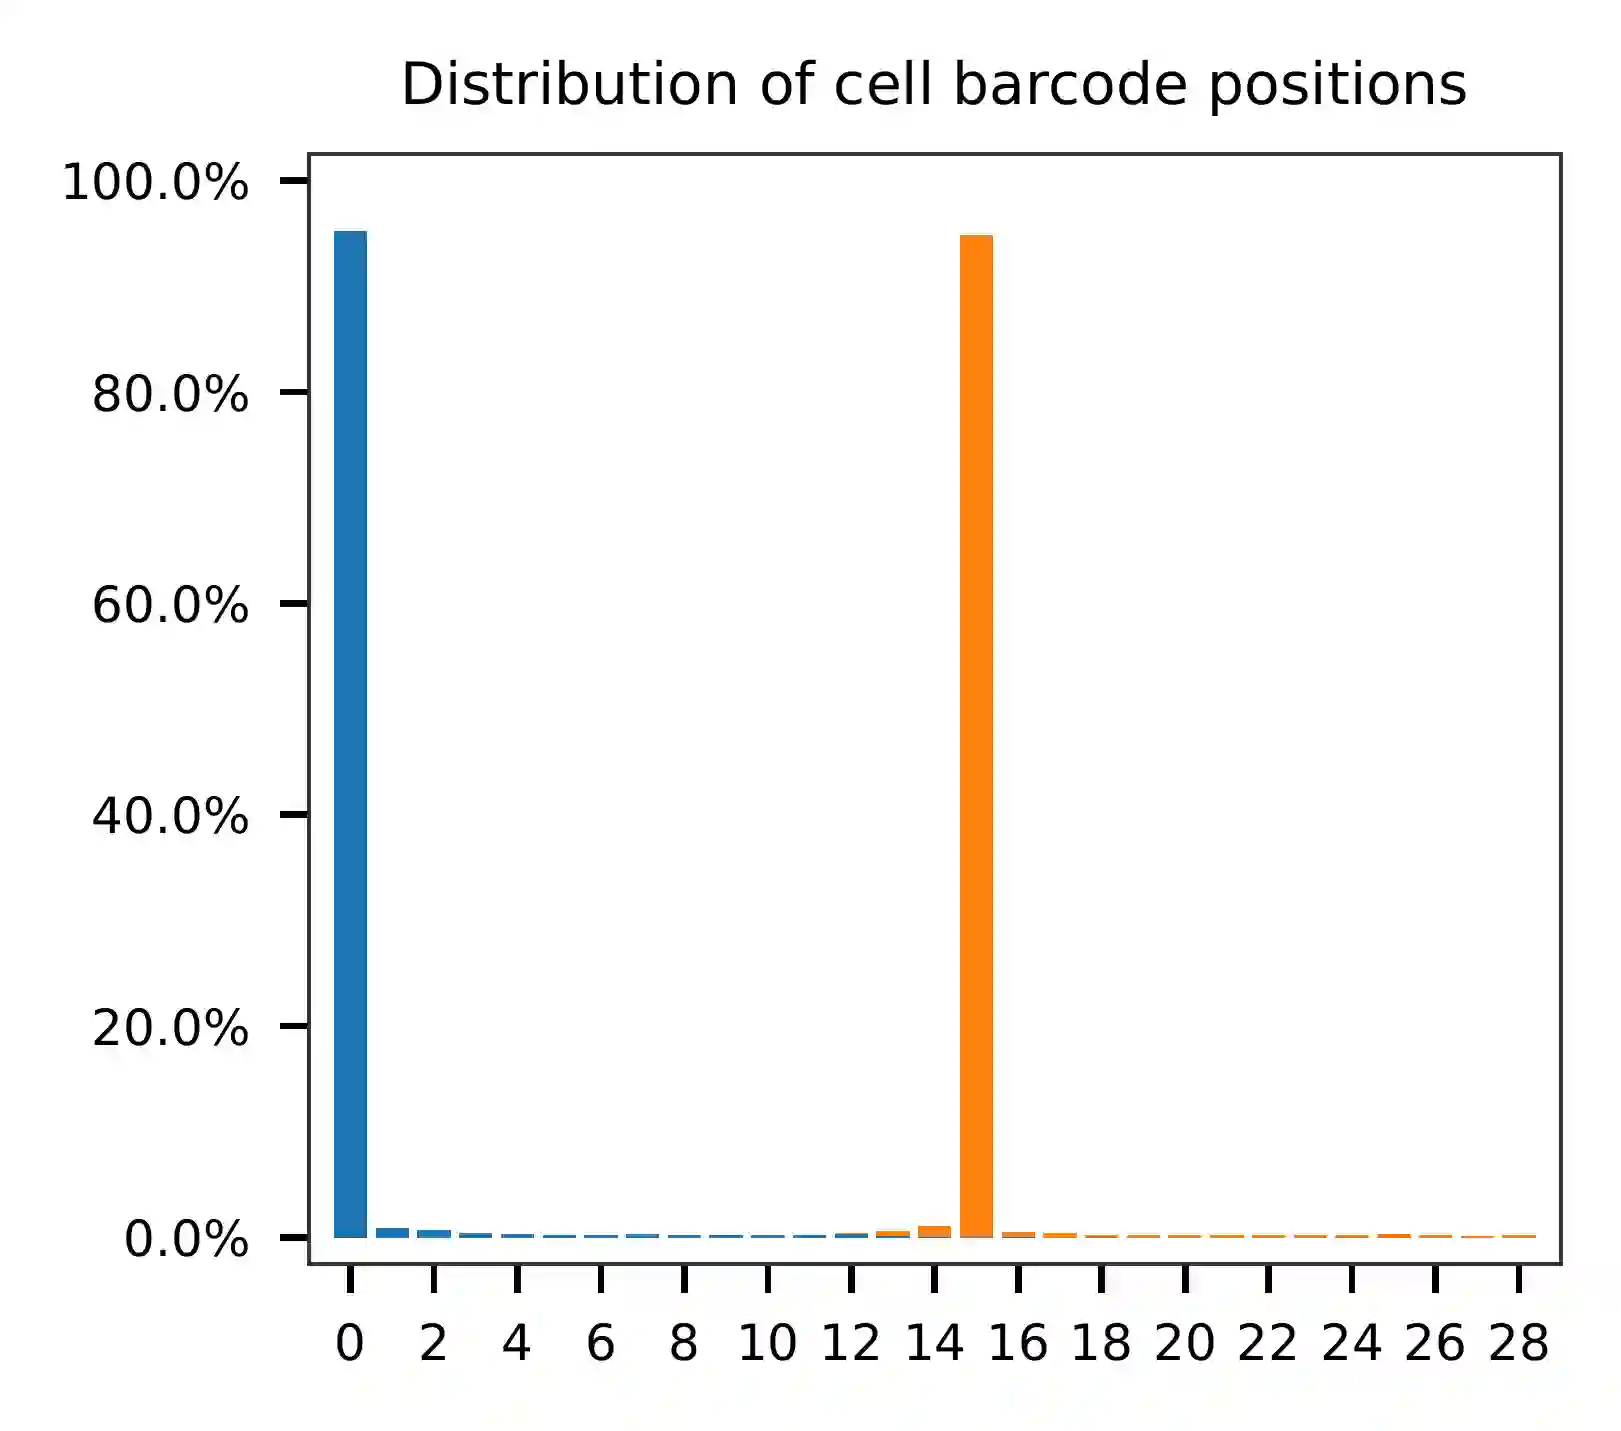
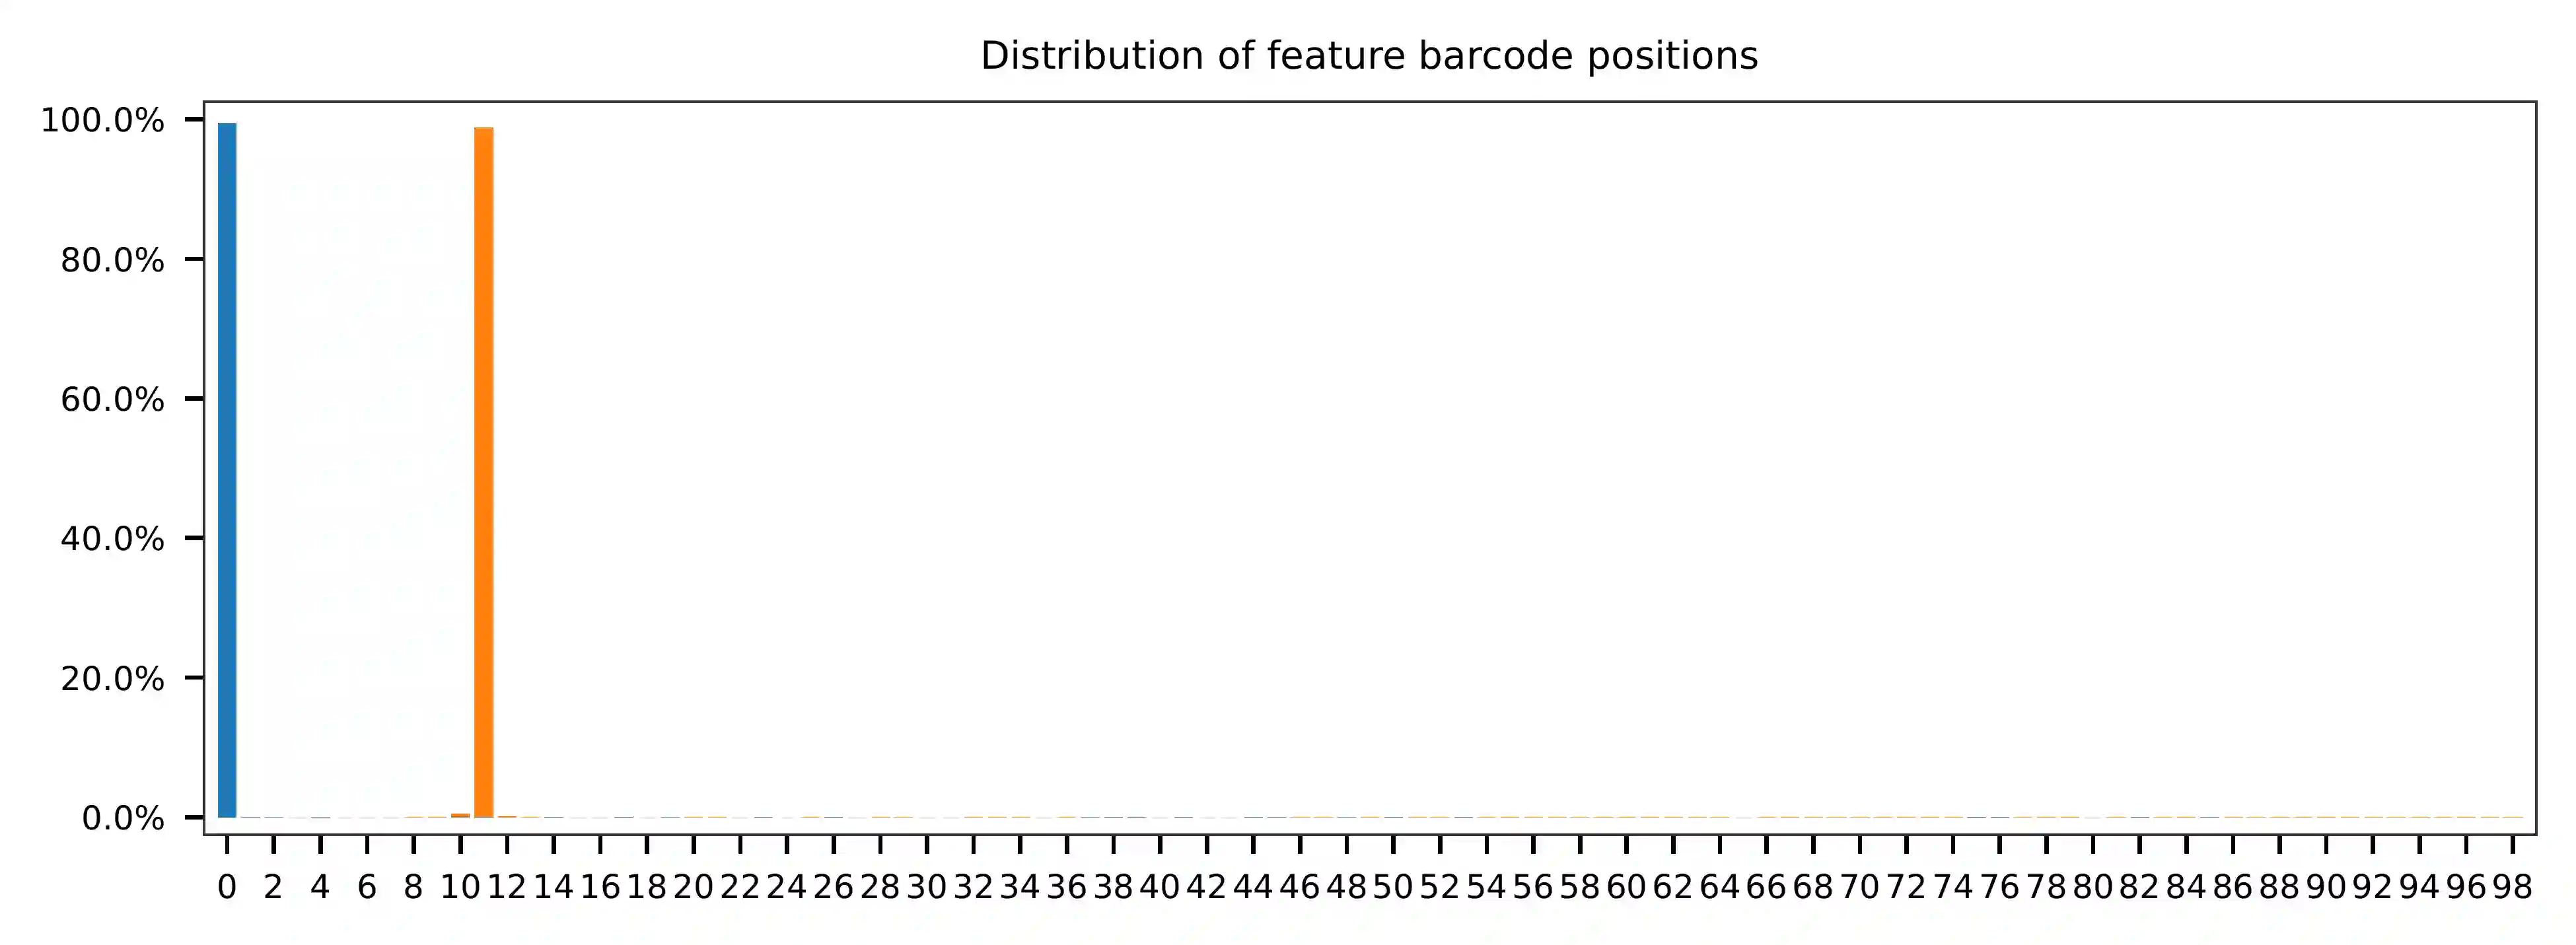
The lengths of cell and feature barcodes (hashtags) are all identical
(16 and 12, respectively). And based on the qc results, the
distributions of starting and ending positions of cell and feature
barcodes are very uniform. Search ranges are set to 0,16 on read 1
and 0,12 on read 2. One mismatch for cell and feature barcodes
(-cb_m, -cf_m) are allowed. By default, three ambiguous
nucleotides (Ns) for read 1 and read2 (-cb_n, -cf_n) are
allowed.
$ fba extract \
    -1 SRR8281307_1.fastq.gz \
    -2 SRR8281307_2.fastq.gz \
    -w cell_barcodes.txt \
    -f feature_barcodes.tsv \
    -o feature_barcoding_output.tsv.gz \
    -r1_coords 0,16 \
    -r2_coords 0,12 \
    -cb_m 1 \
    -fb_m 1 \
    -cb_n 3 \
    -fb_n 3
Preview of result.
$ gzip -dc feature_barcoding_output.tsv.gz | head

read1_seq       cell_barcode    cb_num_mismatches       read2_seq       feature_barcode fb_num_mismatches
NTCCGAACATATGAGAgcaatagtcgttt   ATCCGAACATATGAGA        1       NCATGTTACCGTgaaaaaaaaaaaaaaaaaaaaaaaaaaaaaaaaacagcaattgtcacttataggaggagaagaagggaagggggggggggggggaaa    BatchB_ACATGTTACCGT     1
NTGCGATAGACACTAAgaggagttcattt   ATGCGATAGACACTAA        1       NCGATAATGCGAcaaaaaaaaaaaaaaaaaaaaaaaaaaaaaaaaaaaaccccctttgtttttatcgtaaagatgggaagggggcggtggagggaaaaa    BatchD_TCGATAATGCGA     1
NCACGGAGTTCCCTTGccaatgtagtttt   CCACGGAGTTCCCTTG        1       NGCTTACTATCCtaaaaaaaaaaaaaaaaaaaaaaaaaaaaaaaaatatggggggggggaatcgggggggaggggaaagggggggtgggggaaaaaaga    BatchC_AGCTTACTATCC     1
NGGGATGCAGCTTAACcgggcatcgcttt   AGGGATGCAGCTTAAC        1       NCATGTTACCGTcaaaaaaaaaaaaaaaaaaaaaaaaaaaaaatgaaatggaagtaggggtgtccctagtctgtagaagcggcgactggggaaatgtat    BatchB_ACATGTTACCGT     1
NTTGTCACATACGCTAcgagcctgcattt   TTTGTCACATACGCTA        1       NATCACATCGGTtaaaaaaaaaaaaaaaaaaaaaaaaaaaagaaggccggggggggggggaaaaaaaaaaaaaaaaagggcggggtggggagagagtga    BatchH_TATCACATCGGT     1
NGCTCTCGTTCCACGGaggttatcggttt   AGCTCTCGTTCCACGG        1       NCTGTCTAACGGgaaaaaaaaaaaaaaaaaaaaaaaaaaaaaaaaaaacccccggggaggggaaaaaaagcaggaaaagcgccatgggggaaaaaaaaa    BatchG_ACTGTCTAACGG     1
GATCTAGCAATGTTGCcaaccattttttt   GATCTAGCAATGTTGC        0       AGGACCATCCAAgaaaaaaaaaaaaaaaaaaaaaaaaaaaaaaaaaaaaaaagatggaggaacttggttagaacagaaggaggaggggtggggggggaa    BatchA_AGGACCATCCAA     0
NTTGCGCCATGGTCATagtaacaagattt   TTTGCGCCATGGTCAT        1       NCATGTTACCGTcaaaaaaaaaaaaaaaaaaaaaaaaaaaaatctttttcttttgccctgggcgaaaaagatgggaggagggggggggggggaaagggt    BatchB_ACATGTTACCGT     1
CGCGGTAAGACACTAAcggccgtggtttt   CGCGGTAAGACACTAA        0       TATCACATCGGTtaaaaaaaaaaaaaaaaaaaaaaaaaaaaaaacccgggcgggtggggttttacgaggaaggggagcagggggggtggaggaaaaaaa    BatchH_TATCACATCGGT     0
Result summary.
91.5% (67,916,430 out of 74,219,921) of total read pairs have valid cell and feature barcodes. Majority of the fragments in this library have the correct structure.
2021-02-17 16:16:13,003 - fba.__main__ - INFO - fba version: 0.0.7
2021-02-17 16:16:13,003 - fba.__main__ - INFO - Initiating logging ...
2021-02-17 16:16:13,003 - fba.__main__ - INFO - Python version: 3.7
2021-02-17 16:16:13,003 - fba.__main__ - INFO - Using extract subcommand ...
2021-02-17 16:16:13,026 - fba.levenshtein - INFO - Number of reference cell barcodes: 65,000
2021-02-17 16:16:13,027 - fba.levenshtein - INFO - Number of reference feature barcodes: 8
2021-02-17 16:16:13,027 - fba.levenshtein - INFO - Read 1 coordinates to search: [0, 16)
2021-02-17 16:16:13,027 - fba.levenshtein - INFO - Read 2 coordinates to search: [0, 12)
2021-02-17 16:16:13,027 - fba.levenshtein - INFO - Cell barcode maximum number of mismatches: 1
2021-02-17 16:16:13,027 - fba.levenshtein - INFO - Feature barcode maximum number of mismatches: 1
2021-02-17 16:16:13,027 - fba.levenshtein - INFO - Read 1 maximum number of N allowed: 3
2021-02-17 16:16:13,027 - fba.levenshtein - INFO - Read 2 maximum number of N allowed: 3
2021-02-17 16:16:15,500 - fba.levenshtein - INFO - Matching ...
2021-02-17 16:28:20,306 - fba.levenshtein - INFO - Read pairs processed: 10,000,000
2021-02-17 16:40:24,344 - fba.levenshtein - INFO - Read pairs processed: 20,000,000
2021-02-17 16:52:14,506 - fba.levenshtein - INFO - Read pairs processed: 30,000,000
2021-02-17 17:04:04,292 - fba.levenshtein - INFO - Read pairs processed: 40,000,000
2021-02-17 17:15:52,792 - fba.levenshtein - INFO - Read pairs processed: 50,000,000
2021-02-17 17:27:43,975 - fba.levenshtein - INFO - Read pairs processed: 60,000,000
2021-02-17 17:39:35,941 - fba.levenshtein - INFO - Read pairs processed: 70,000,000
2021-02-17 17:44:36,162 - fba.levenshtein - INFO - Number of read pairs processed: 74,219,921
2021-02-17 17:44:36,162 - fba.levenshtein - INFO - Number of read pairs w/ valid barcodes: 67,916,430
2021-02-17 17:44:36,264 - fba.__main__ - INFO - Done.
Matrix generation
Only fragments with correctly matched cell and feature barcodes are
included, while fragments with UMI lengths less than the specified value
are discarded. UMI removal is performed using UMI-tools (Smith, T., et
al. 2017. Genome Res. 27, 491–499.), with the starting position on
read 1 set by -us (default 16) and the length set by -ul
(default 12). The UMI deduplication method can be set using -ud
(default directional), and the UMI deduplication mismatch threshold
can be specified using -um (default 1).
The generated feature count matrix can be easily imported into well-established single cell analysis packages: Seurat and Scanpy.
$ fba count \
    -i feature_barcoding_output.tsv.gz \
    -o matrix_featurecount.csv.gz \
    -us 16 \
    -ul 10 \
    -um 1 \
    -ud directional
Result summary.
25.1% (17,022,991 out of 67,916,430) of read pairs with valid cell and feature barcodes are unique fragments. 22.9% (17,022,991 out of 74,219,921) of total sequenced read pairs contribute to the final matrix.
2021-02-17 17:44:43,315 - fba.__main__ - INFO - fba version: 0.0.7
2021-02-17 17:44:43,315 - fba.__main__ - INFO - Initiating logging ...
2021-02-17 17:44:43,315 - fba.__main__ - INFO - Python version: 3.7
2021-02-17 17:44:43,315 - fba.__main__ - INFO - Using count subcommand ...
2021-02-17 17:44:43,315 - fba.count - INFO - UMI-tools version: 1.1.1
2021-02-17 17:44:43,318 - fba.count - INFO - UMI starting position on read 1: 16
2021-02-17 17:44:43,318 - fba.count - INFO - UMI length: 10
2021-02-17 17:44:43,318 - fba.count - INFO - UMI-tools deduplication threshold: 1
2021-02-17 17:44:43,318 - fba.count - INFO - UMI-tools deduplication method: directional
2021-02-17 17:44:43,318 - fba.count - INFO - Header line: read1_seq cell_barcode cb_num_mismatches read2_seq feature_barcode fb_num_mismatches
2021-02-17 17:48:32,866 - fba.count - INFO - Number of lines processed: 67,916,430
2021-02-17 17:48:33,127 - fba.count - INFO - Number of cell barcodes detected: 64,998
2021-02-17 17:48:33,127 - fba.count - INFO - Number of features detected: 8
2021-02-17 18:01:15,176 - fba.count - INFO - Total UMIs after deduplication: 17,022,991
2021-02-17 18:01:15,298 - fba.count - INFO - Median number of UMIs per cell: 63.0
2021-02-17 18:01:16,924 - fba.__main__ - INFO - Done.
Demultiplexing
Negative binomial distribution
Cells are classified based on the abundance of features (HTOs, no
transcriptome information used). Demultiplexing method 1 (set by
-dm) is implemented based on the method described in Stoeckius, M.,
et al. (2018) with some modifications. A cell identity matrix is
generated in the output directory (set by --output_directory,
default demultiplexed): 0 means negative, 1 means positive. To
adjust the quantile threshold for demultiplexing, use -q (Default
0.9999). To generate visualization plots, set -v.
$ fba demultiplex \
    -i matrix_featurecount.csv.gz \
    --output_directory demultiplexed \
    -dm 1 \
    -v
2021-02-18 01:27:19,172 - fba.__main__ - INFO - fba version: 0.0.7
2021-02-18 01:27:19,173 - fba.__main__ - INFO - Initiating logging ...
2021-02-18 01:27:19,173 - fba.__main__ - INFO - Python version: 3.7
2021-02-18 01:27:19,173 - fba.__main__ - INFO - Using demultiplex subcommand ...
2021-02-18 01:27:19,177 - fba.demultiplex - INFO - Output directory: demultiplexed
2021-02-18 01:27:19,177 - fba.demultiplex - INFO - Loading feature count matrix: matrix_featurecount.csv.gz ...
2021-02-18 01:27:22,932 - fba.demultiplex - INFO - Number of cells: 64,998
2021-02-18 01:27:22,932 - fba.demultiplex - INFO - Number of features: 8
2021-02-18 01:27:22,932 - fba.demultiplex - INFO - Total UMIs: 17,021,991
2021-02-18 01:27:23,029 - fba.demultiplex - INFO - Median number of UMIs per cell: 63.0
2021-02-18 01:27:23,029 - fba.demultiplex - INFO - Demultiplexing ...
2021-02-18 03:19:27,245 - fba.demultiplex - INFO - Generating heatmap ...
2021-02-18 03:20:37,827 - fba.demultiplex - INFO - Embedding ...
2021-02-18 03:21:21,120 - fba.__main__ - INFO - Done.
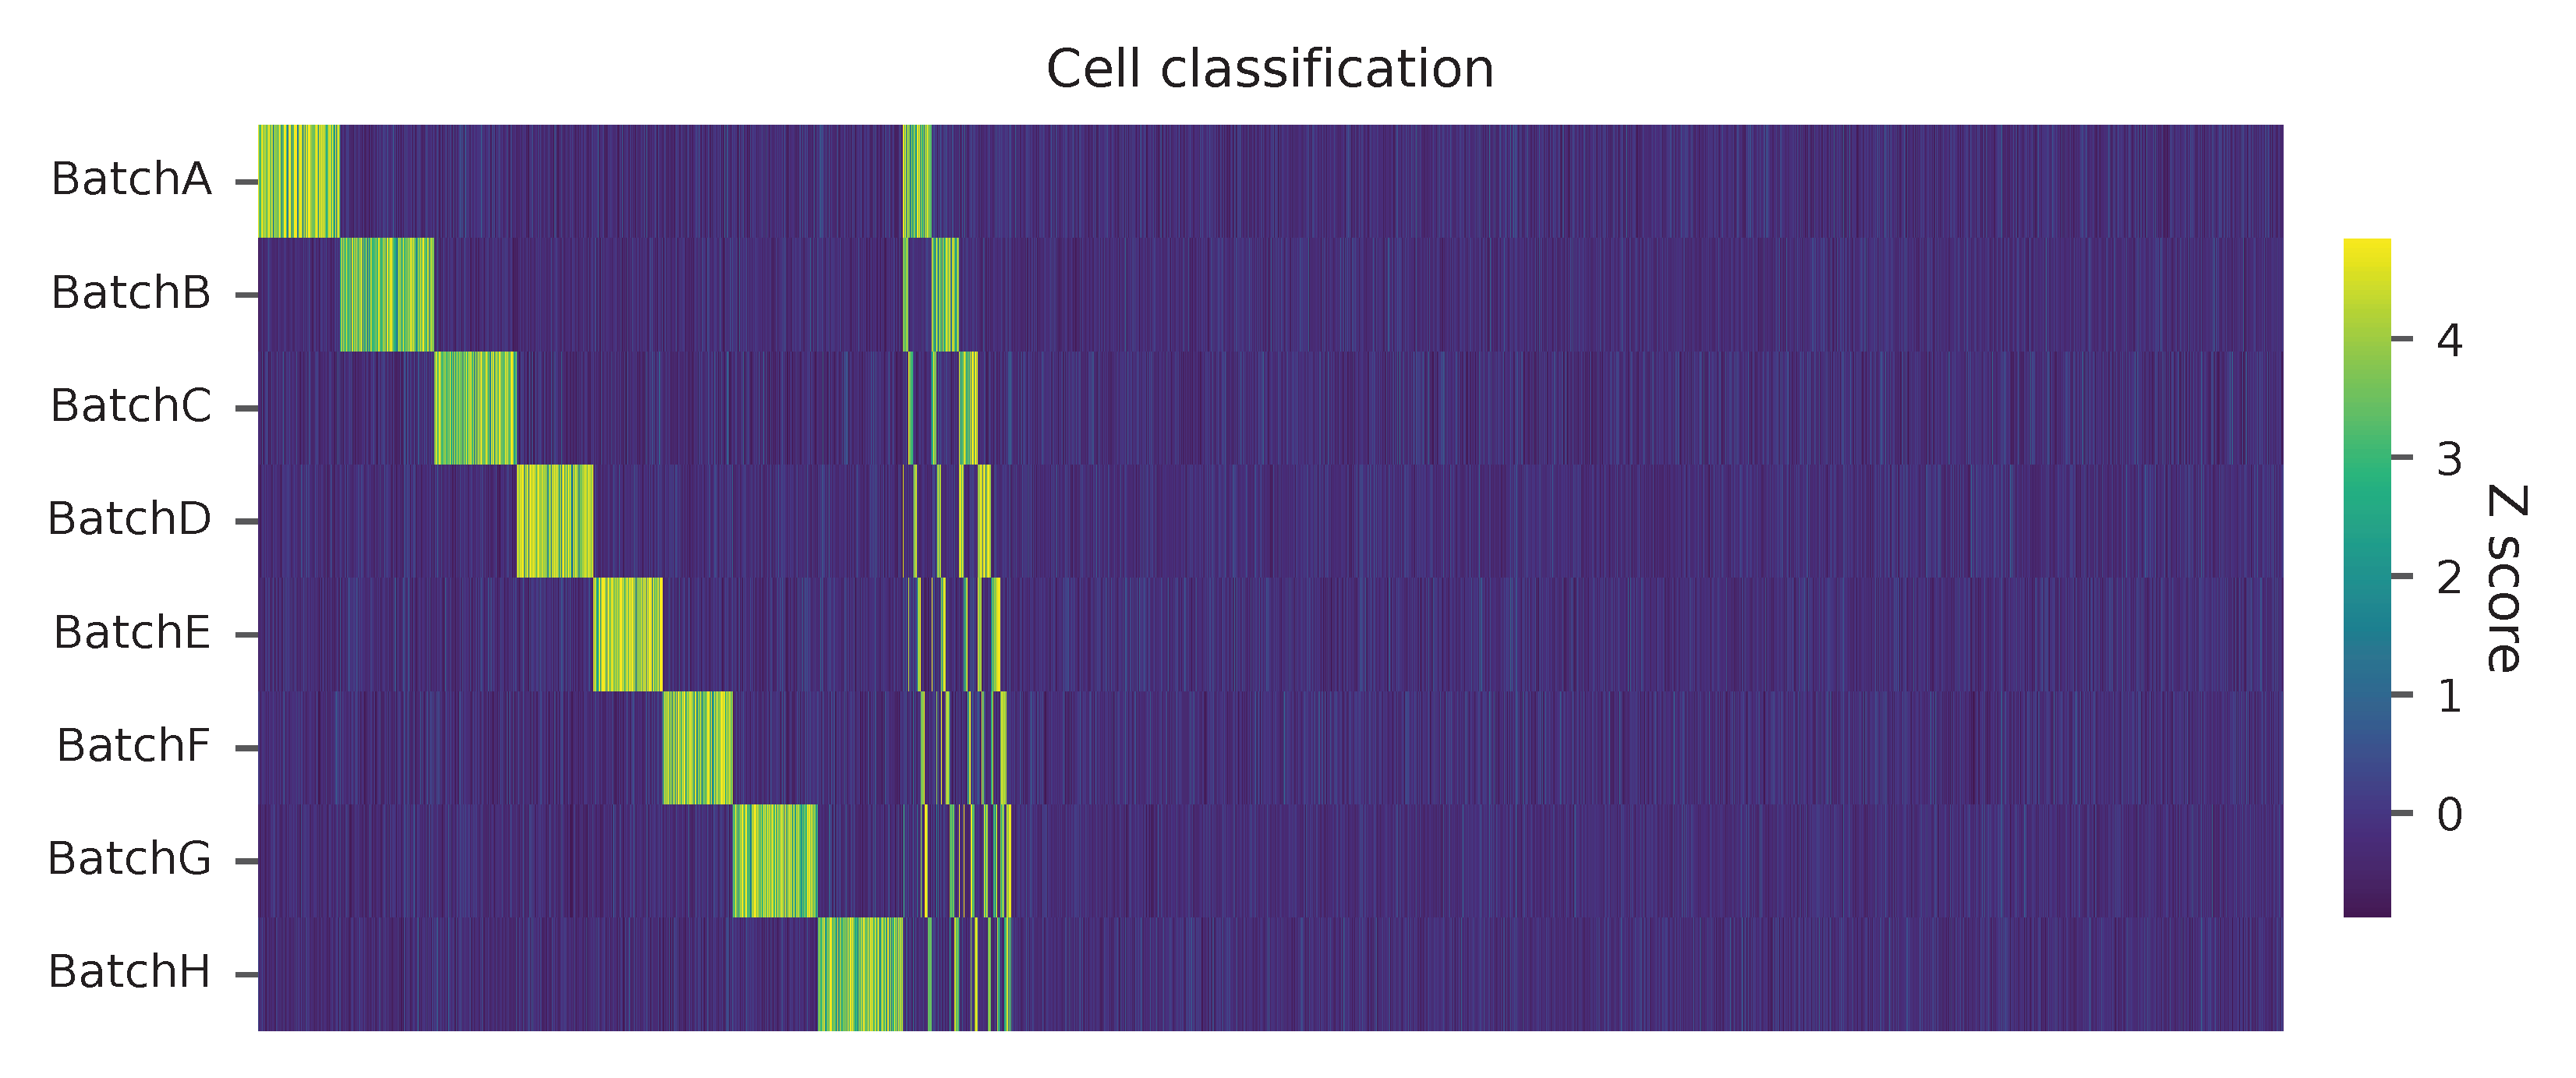
Heatmap of the relative abundance of features (HTOs) across all cells. Each column represents a single cell. This is a re-creation of Fig. 1c in Stoeckius, M., et al. (2018).
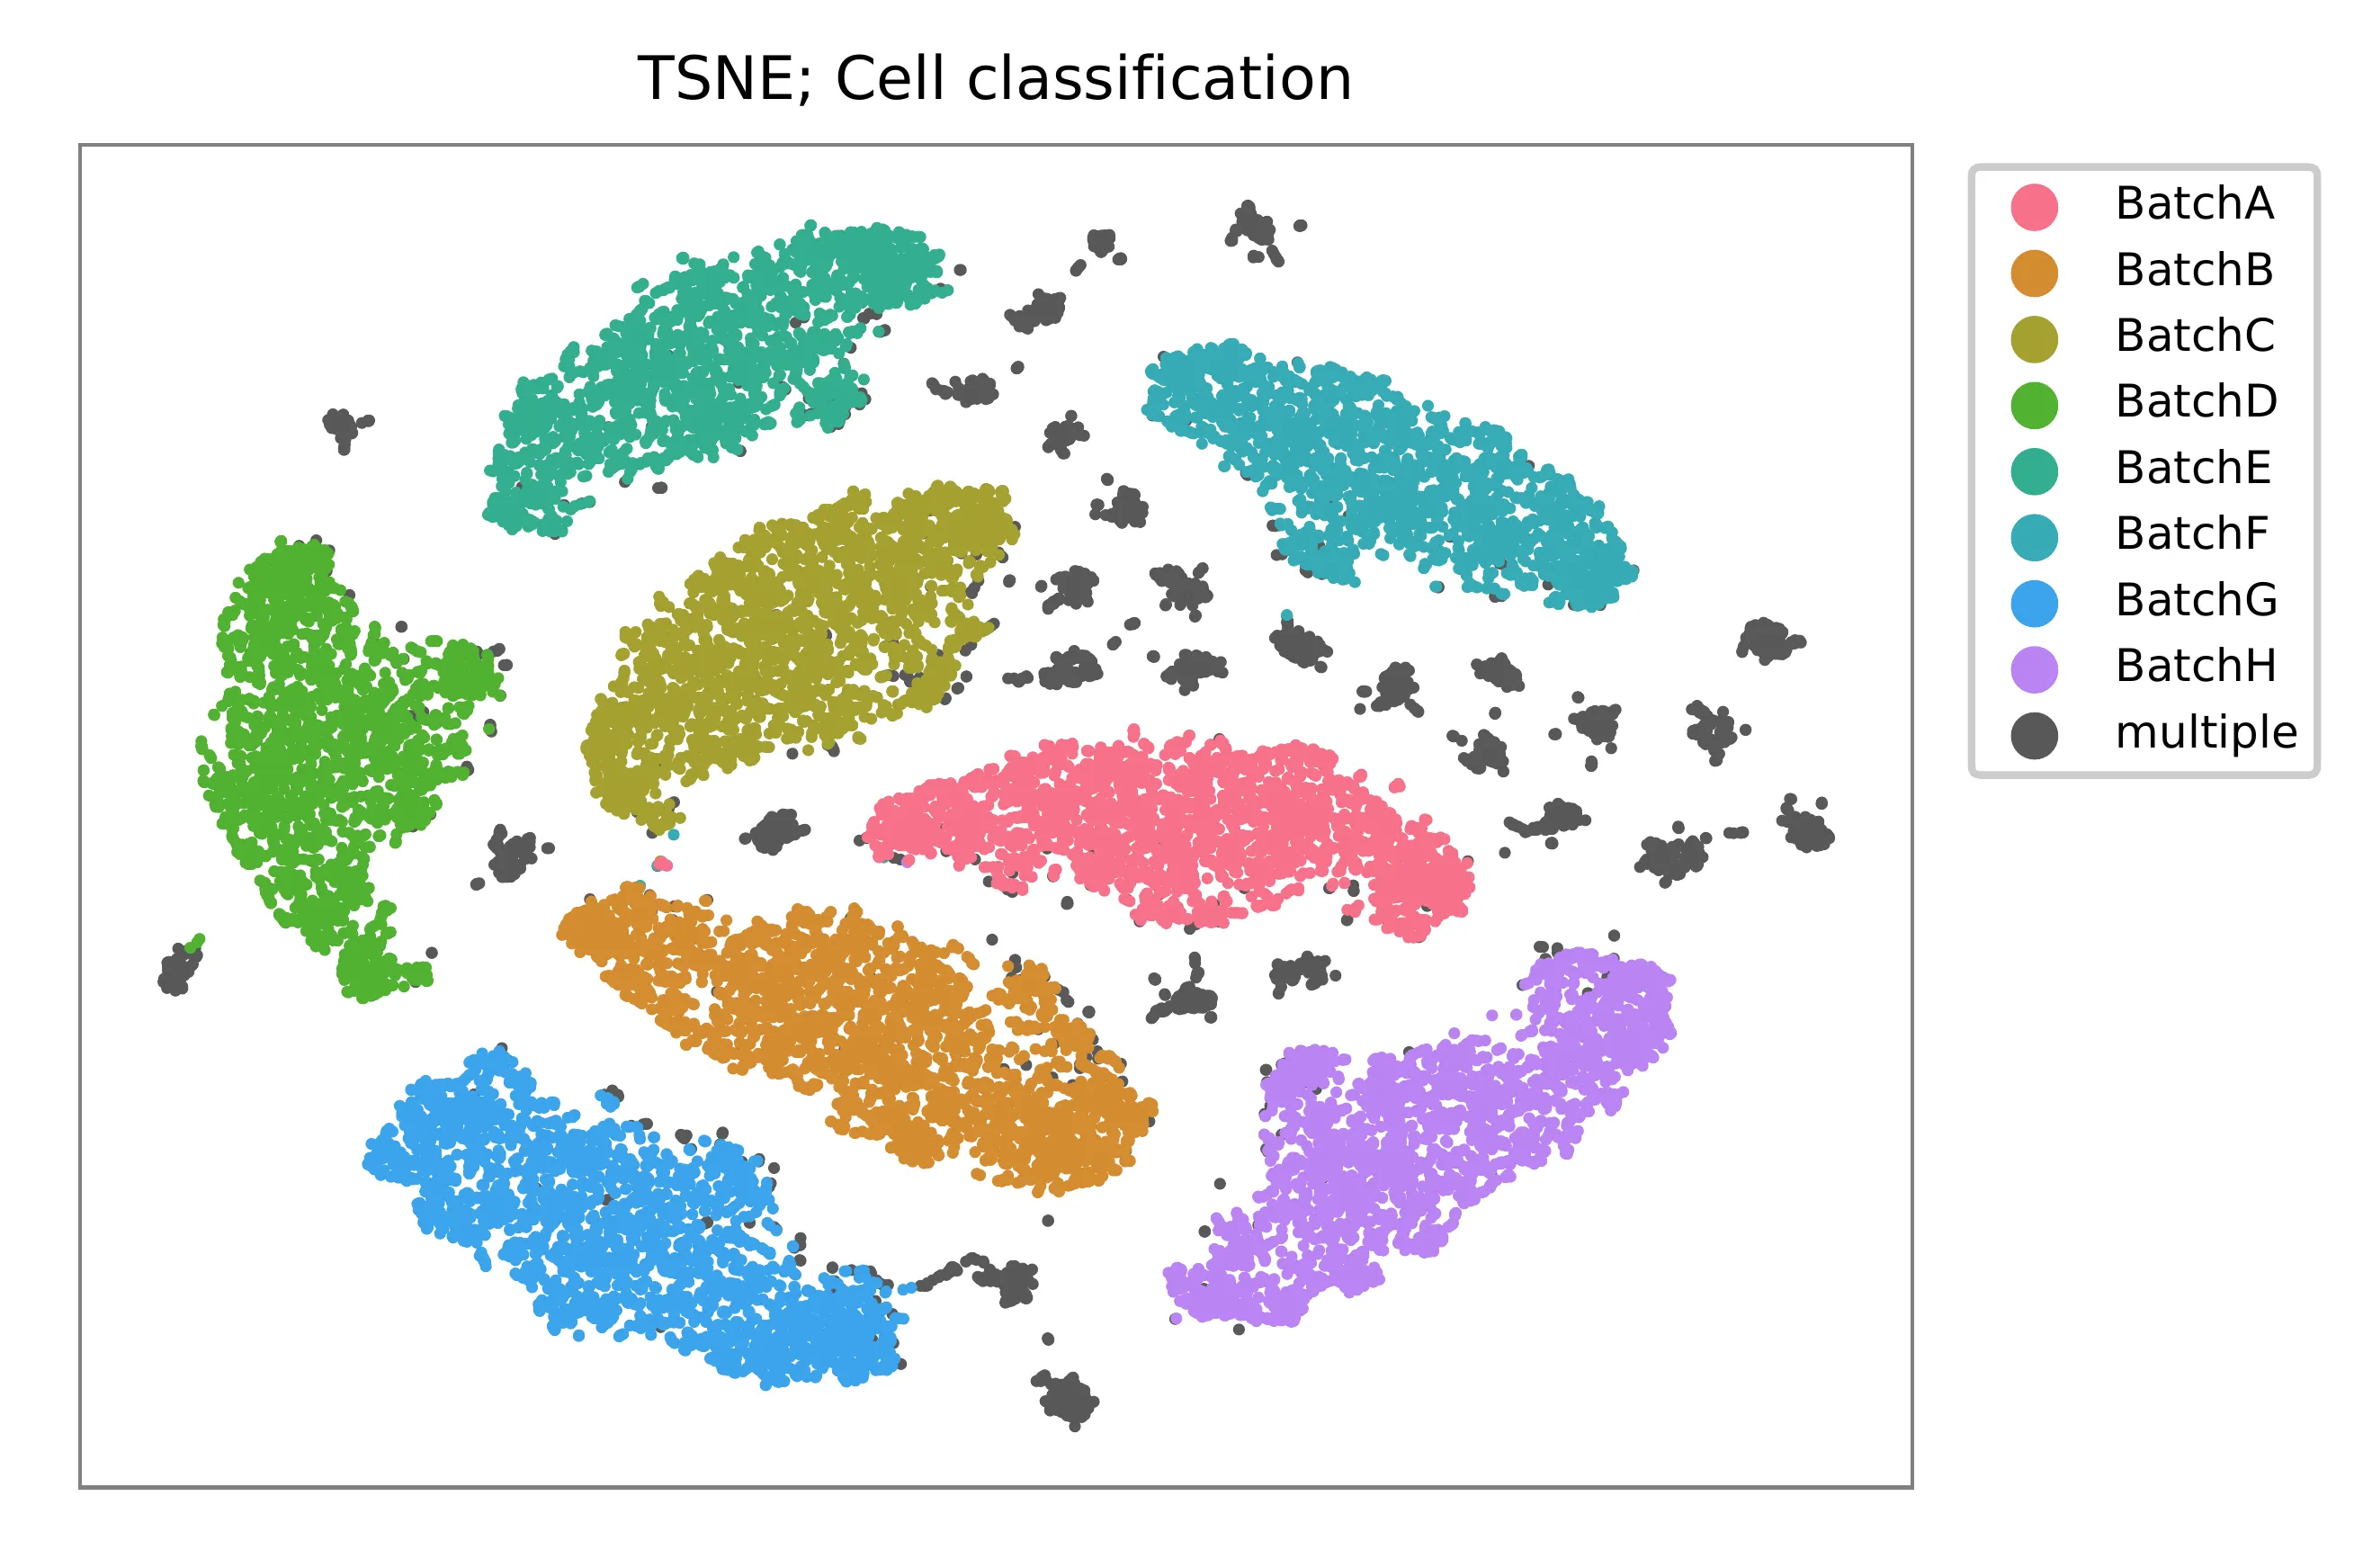
t-SNE embedding of cells based on the abundance of features (HTOs, no transcriptome information used). Colors indicate the HTO status for each cell, as called by FBA. This is a re-creation of Fig. 1d in Stoeckius, M., et al. (2018).
Preview the demultiplexing result: the numbers of singlets. The result in Stoeckius, M., et al. (2018) can be found in Additional file 3.
In [1]: import pandas as pd

In [2]: m = pd.read_csv("demultiplexed/matrix_cell_identity.csv.gz", index_col=0)

In [3]: m.loc[:, m.sum(axis=0) == 1].sum(axis=1)
Out[3]:
BatchA    2637
BatchB    3019
BatchC    2666
BatchD    2441
BatchE    2242
BatchF    2234
BatchG    2747
BatchH    2719
dtype: int64
Gaussian mixture model
Alternatively, cells can be demultiplexed using gaussian mixture model.
The implementation of demultiplexing method 2 (set by -dm) is
inspired by the method described on 10x Genomics’ website. To set the
probability threshold for demultiplexing, use -p (default 0.9).
To generate visualization plots, set -v.
$ fba demultiplex \
    -i matrix_featurecount.csv.gz \
    -dm 2 \
    -v
2021-12-27 11:37:31,026 - fba.__main__ - INFO - fba version: 0.0.x
2021-12-27 11:37:31,026 - fba.__main__ - INFO - Initiating logging ...
2021-12-27 11:37:31,026 - fba.__main__ - INFO - Python version: 3.9
2021-12-27 11:37:31,026 - fba.__main__ - INFO - Using demultiplex subcommand ...
2021-12-27 11:37:33,496 - fba.__main__ - INFO - Skipping arguments: "-q/--quantile", "-cm/--clustering_method"
2021-12-27 11:37:33,496 - fba.demultiplex - INFO - Output directory: demultiplexed
2021-12-27 11:37:33,496 - fba.demultiplex - INFO - Demultiplexing method: 2
2021-12-27 11:37:33,496 - fba.demultiplex - INFO - UMI normalization method: clr
2021-12-27 11:37:33,496 - fba.demultiplex - INFO - Visualization: On
2021-12-27 11:37:33,496 - fba.demultiplex - INFO - Visualization method: tsne
2021-12-27 11:37:33,496 - fba.demultiplex - INFO - Loading feature count matrix: matrix_featurecount.csv.gz ...
2021-12-27 11:37:34,111 - fba.demultiplex - INFO - Number of cells: 64,998
2021-12-27 11:37:34,111 - fba.demultiplex - INFO - Number of positive cells for a feature to be included: 200
2021-12-27 11:37:34,205 - fba.demultiplex - INFO - Number of features: 8 / 8 (after filtering / original in the matrix)
2021-12-27 11:37:34,205 - fba.demultiplex - INFO - Features: BatchA BatchB BatchC BatchD BatchE BatchF BatchG BatchH
2021-12-27 11:37:34,206 - fba.demultiplex - INFO - Total UMIs: 17,021,991 / 17,021,991
2021-12-27 11:37:34,254 - fba.demultiplex - INFO - Median number of UMIs per cell: 63.0 / 63.0
2021-12-27 11:37:34,254 - fba.demultiplex - INFO - Demultiplexing ...
2021-12-27 11:37:48,810 - fba.demultiplex - INFO - Generating heatmap ...
2021-12-27 11:38:10,642 - fba.demultiplex - INFO - Embedding ...
2021-12-27 11:38:54,942 - fba.__main__ - INFO - Done.
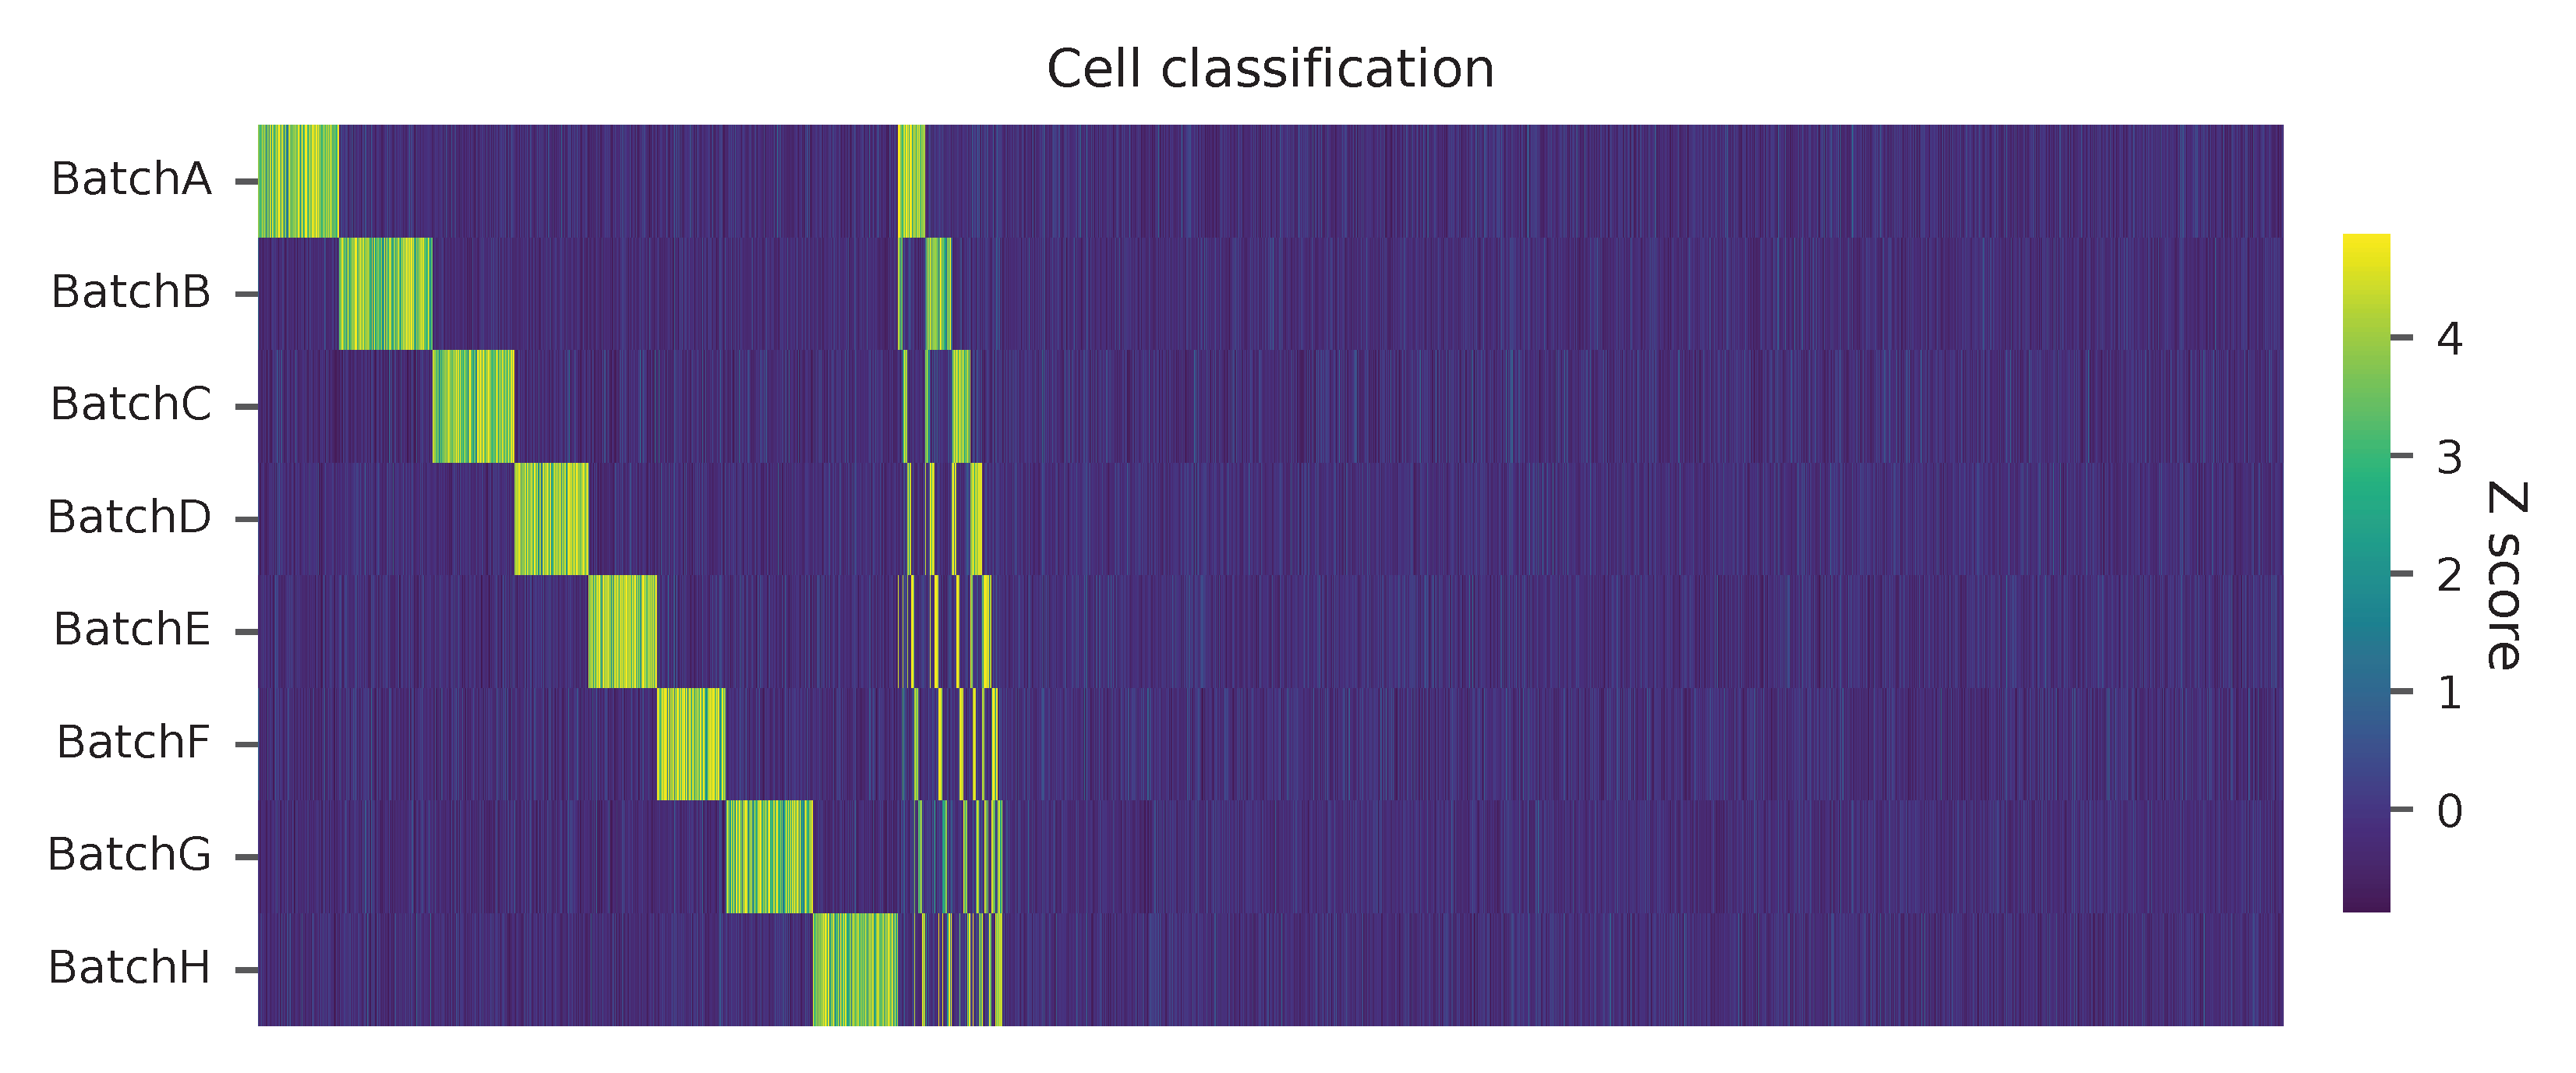
Heatmap of the relative abundance of features (HTOs) across all cells. Each column represents a single cell.
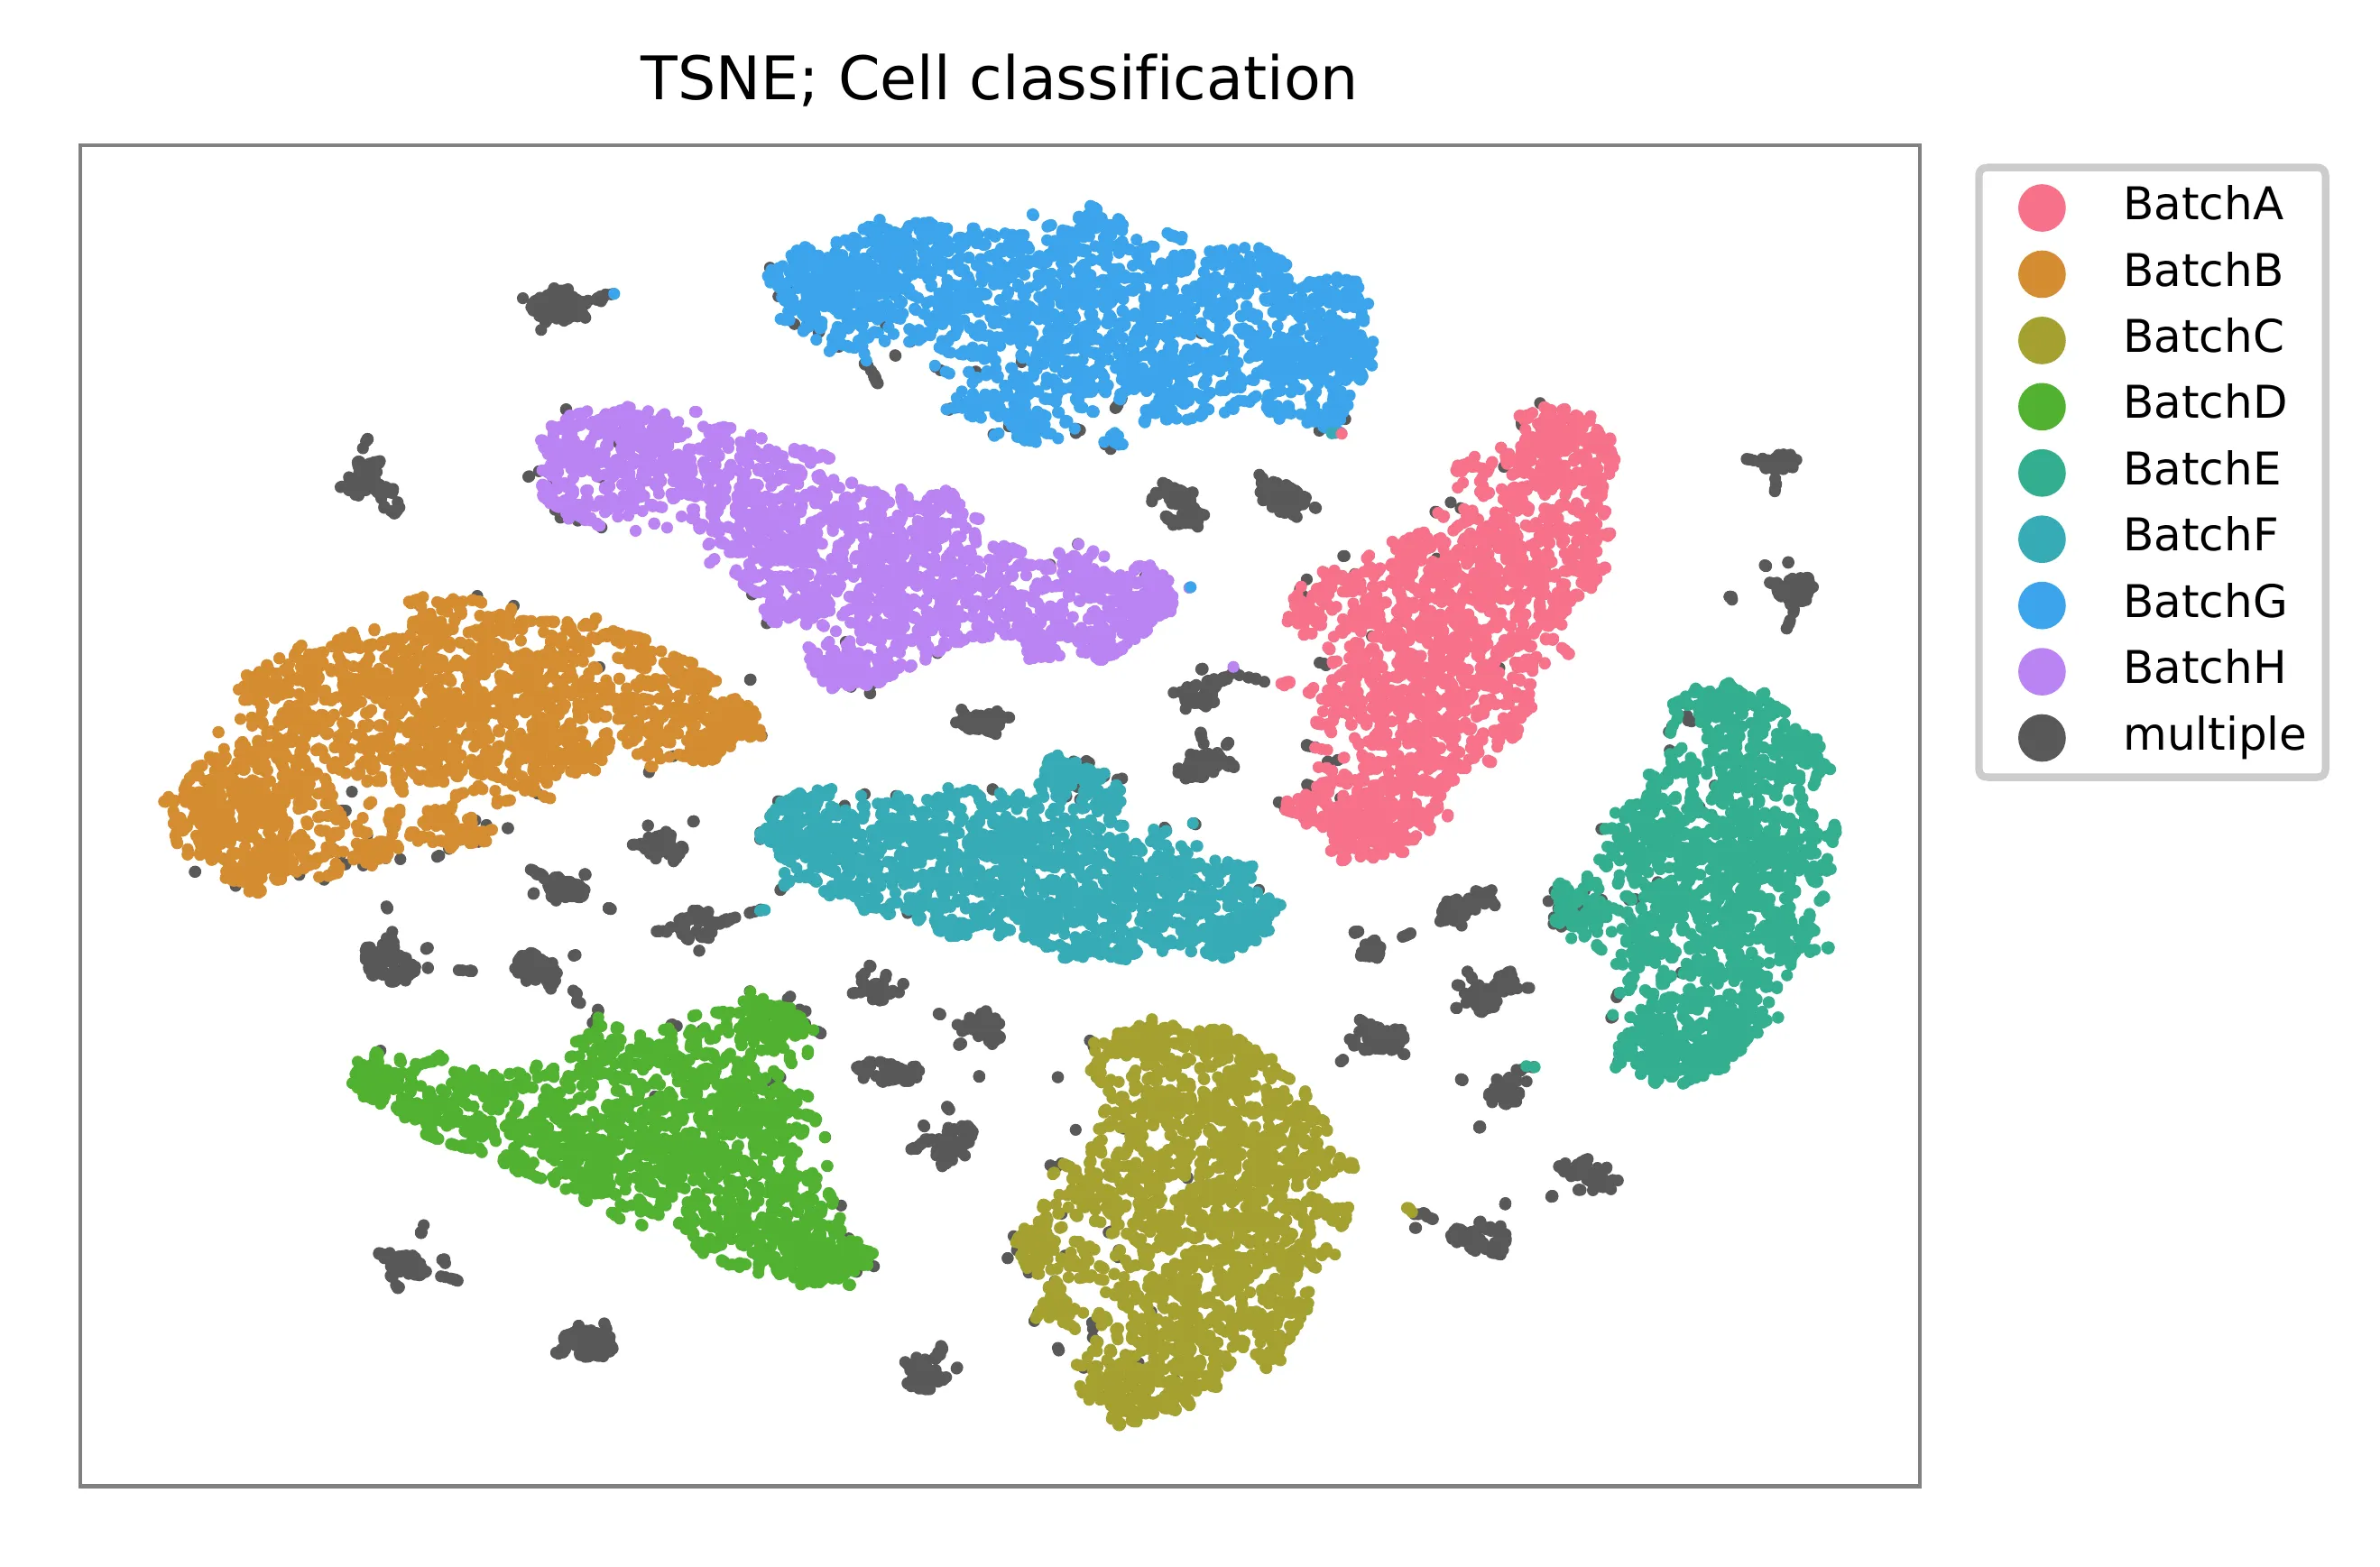
t-SNE embedding of cells based on the abundance of features (HTOs, no transcriptome information used). Colors indicate the HTO status for each cell, as called by FBA. This is a re-creation of Fig. 1d in Stoeckius, M., et al. (2018).
Preview the demultiplexing result: the numbers of singlets.
In [1]: import pandas as pd

In [2]: m = pd.read_csv("demultiplexed/matrix_cell_identity.csv.gz", index_col=0)

In [3]: m.loc[:, m.sum(axis=0) == 1].sum(axis=1)
Out[3]:
BatchA    2618
BatchB    2979
BatchC    2648
BatchD    2368
BatchE    2198
BatchF    2201
BatchG    2810
BatchH    2721
dtype: int64