Direct-capture Perturb-seq; CRISPRi-based Screen of Unfolded Protein Response (UPR) Using 3’ sgRNA-CR1cs1
Dataset: Direct-capture Perturb-seq (sgRNA-CR1cs1)
Replogle, J.M., Norman, T.M., Xu, A., Hussmann, J.A., Chen, J., Cogan, J.Z., Meer, E.J., Terry, J.M., Riordan, D.P., Srinivas, N., et al. (2020). Combinatorial single-cell CRISPR screens by direct guide RNA capture and targeted sequencing. Nat. Biotechnol. 38, 954–961.
Preparation
Download fastq files from Gene Expression Omnibus.
$ cat SRR11214033_2.fastq.gz SRR11214034_2.fastq.gz SRR11214035_2.fastq.gz SRR11214036_2.fastq.gz > GSM4367980_1.fq.gz

$ cat SRR11214033_3.fastq.gz SRR11214034_3.fastq.gz SRR11214035_3.fastq.gz SRR11214036_3.fastq.gz > GSM4367980_2.fq.gz
Prepare cell barcodes.
$ wget https://ftp.ncbi.nlm.nih.gov/geo/samples/GSM4367nnn/GSM4367979/suppl/GSM4367979_exp1-5.barcodes.tsv.gz

$ gzip -dc GSM4367979_exp1-5.barcodes.tsv.gz | grep '\-4' > cell_barcodes.txt
Inspect cell barcodes (Fig. 2d, middle column).
$ wc -l cell_barcodes.txt

8727

$ head cell_barcodes.txt

AAACCCAAGAGGGCGA-4
AAACCCACACCCTCTA-4
AAACCCACATAGATGA-4
AAACCCACATATCGGT-4
AAACCCATCATGAGTC-4
AAACCCATCCGGTAAT-4
AAACCCATCCTGCCAT-4
AAACCCATCTCACCCA-4
AAACGAAAGCCTGACC-4
AAACGAAAGTGCCGAA-4
Prepare feature barcodes. sgRNA sequences can be found in Supplementary Table 2 and are truncated to equal length.
$ cat feature_barcodes_UPR_edited.tsv

NegCtrl2        GCGATGGGGGGGTGGGTAG
NegCtrl3        GACGACTAGTTAGGCGTGT
DDRGK1  GCGGTCCACAAAGGCTCAG
UFL1    GTGACTCGCAGTAGACGCG
UFM1    GCGGTAAGCAAACACTTAC
SEC61G  GCTCCAGTGCTACGTGTCC
SEC61A1 GCTGTGCAGTGGAACGCGC
SRP68   GAGAAGCAGGTCCCAGGCG
SRPRB   GGCCACCCGGCGCGAGTCC
SRPR    GGCGAACGCGGCCTGAATT
SRP72   GCCTCCAAGATGGCGAGCG
TIMM23  GAAGTAGGCGCTGGCAACG
ATP5B   GAGTCTCCGCAAGGCCCCG
MRPL39  GTCTGGCTGGTCGCACCCG
TMED2   GTGAGGCCGAAGCCAGGAC
TMED10  GAGACTCGTTCACCACCGA
CARS    GAGCCATGGCAGATTCCTC
HARS    GCTCAAGTGGACAGCCGGG
QARS    GCGCGCTCAGTGAGAGGAA
TTI1    GAAGGCTGGAAGACGAGGT
TELO2   GCCGCGGAGACCCGCCCCA
TTI2    GTCCGGATCCTGTTAGACA
TMEM167A        GCAGCCACATCACCCTTCC
YIPF5   GGGTGCAGGGGACCGCGTC
SCYL1   GGCCGGAGGACCCGGAGCT
IER3IP1 GGGGCCCCATCGGCTTCCG
DDOST   GTGGGTCCTTCGGCAGGAG
DAD1    GACCTTGCGTGCAGTTATG
OST4    GGCTTGTTCGCTGGTGGCG
EIF2B4  GCTGAGGGCGATGGCTGCT
EIF2B2  GTAGCTGCCTTCAGCCTTC
EIF2B3  GCCATTGGGCTGTCAGTCA
First we screen reads that have the constant sequence (GTACATGGGG)
upstream of sgRNAs on read 2 (cutadapt, version 3.7).
$ cutadapt \
    --cores 0 \
    --front GTACATGGGG \
    --length 50 \
    --minimum-length 50:26 \
    --trimmed-only \
    --output read_2_trimmed.fq.gz --paired-output read_1_trimmed.fq.gz \
    GSM4367980_2.fq.gz GSM4367980_1.fq.gz
Preview the filtering result: 104,375,315 out of 404,963,129 (25.8%) read pairs are kept for sgRNA identification.
== Read fate breakdown ==
Pairs that were too short:             377,332 (0.1%)
Pairs discarded as untrimmed:      300,210,482 (74.1%)
Pairs written (passing filters):   104,375,315 (25.8%)
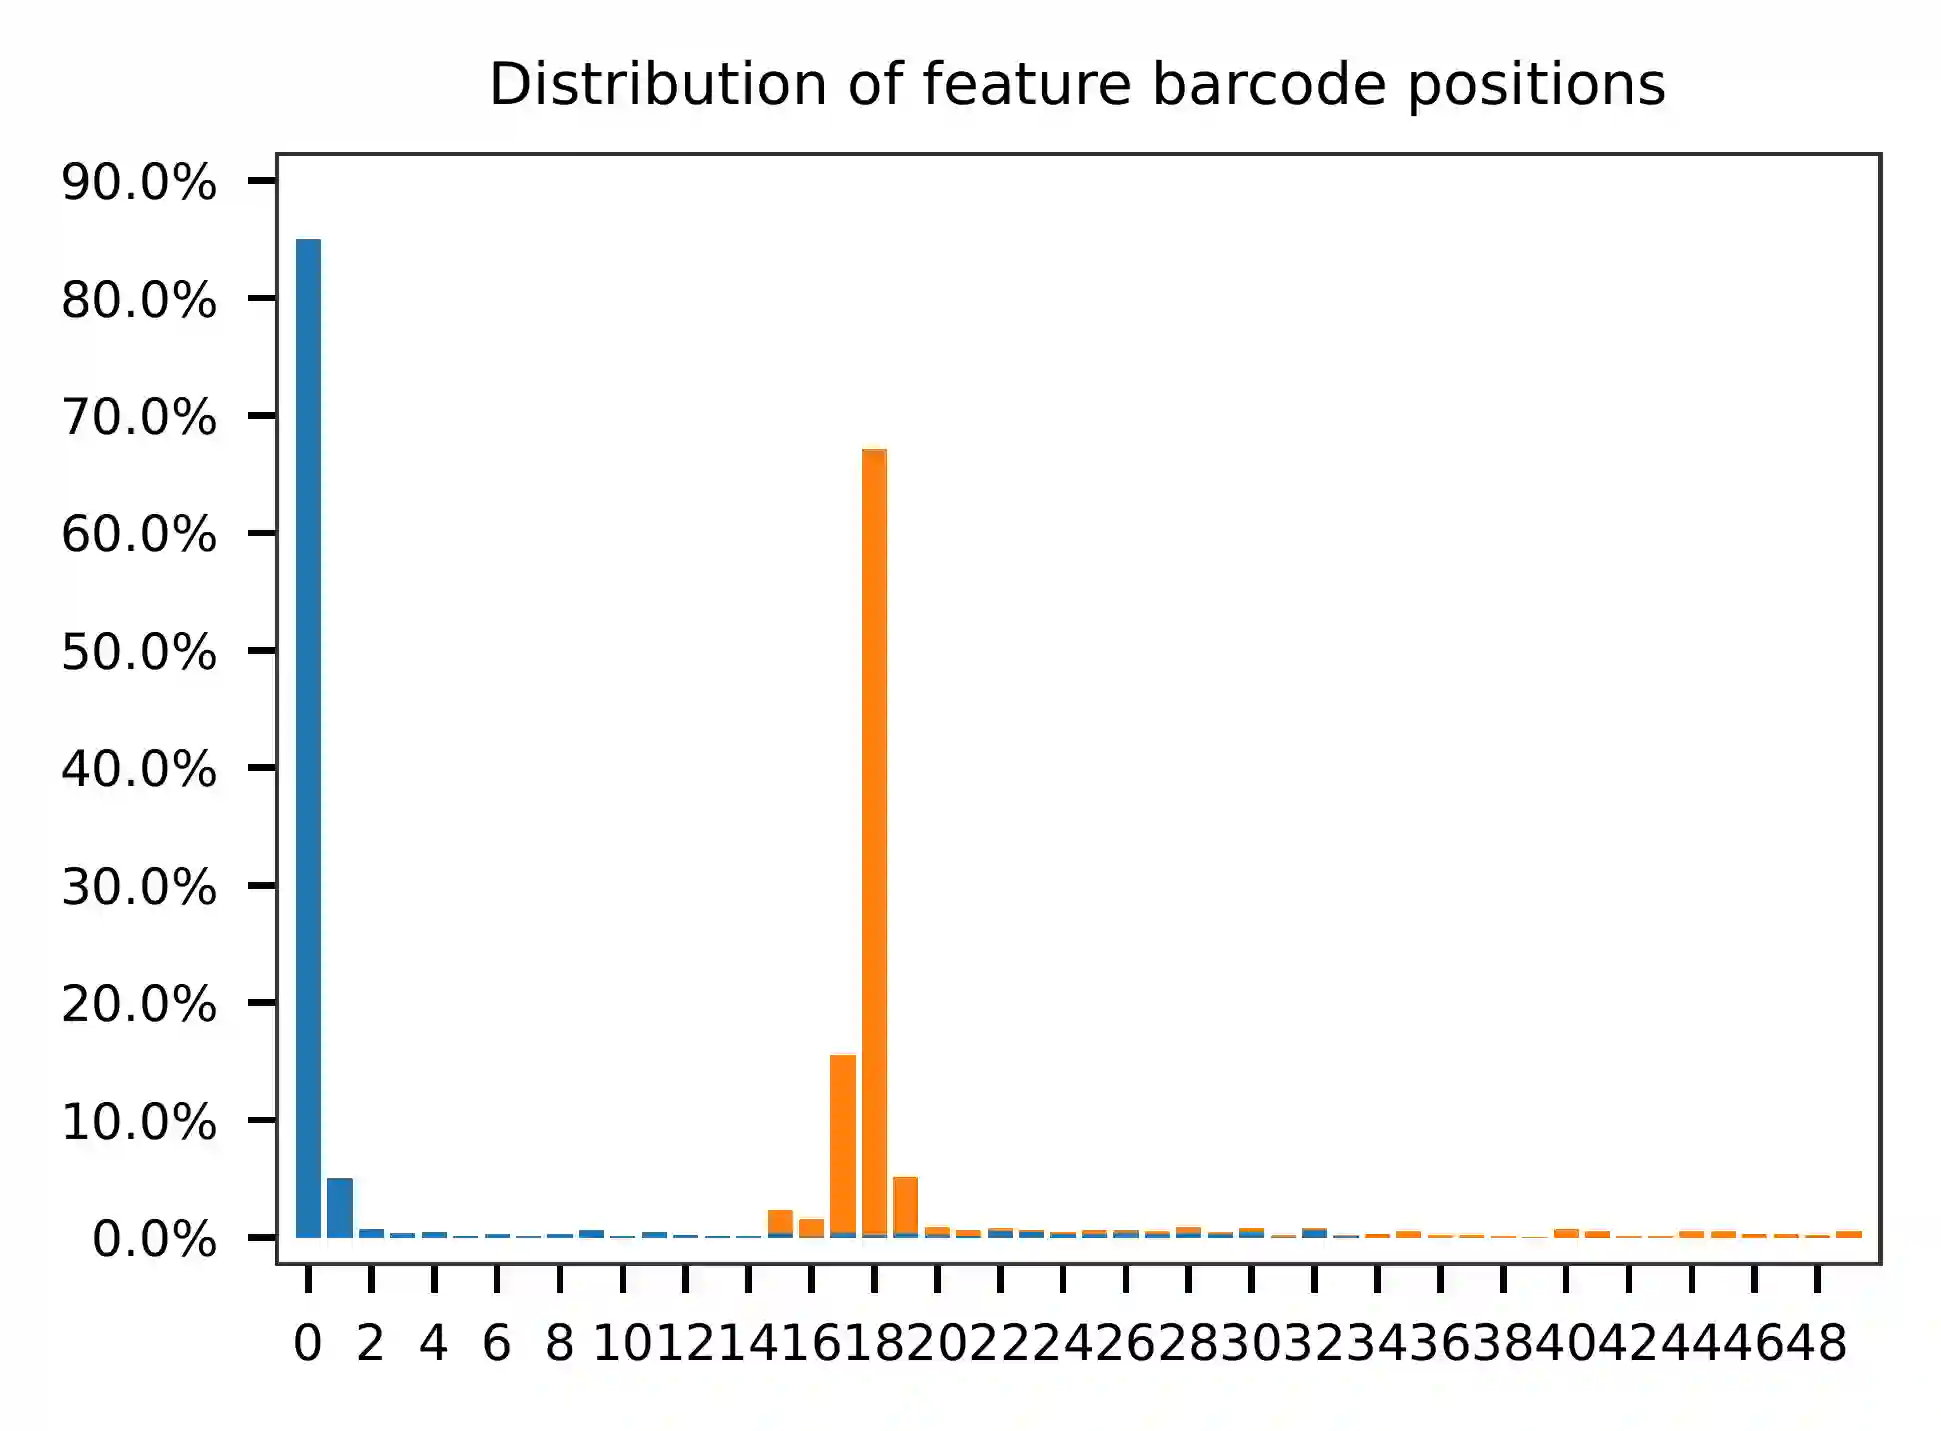
QC
The first 200,000 read pairs are sampled (set by -n, default
100,000) for quality control. The -t option can be used to set
the number of threads. By default, diagnostic results and plots are
generated in the qc directory (set by --output_directory), and
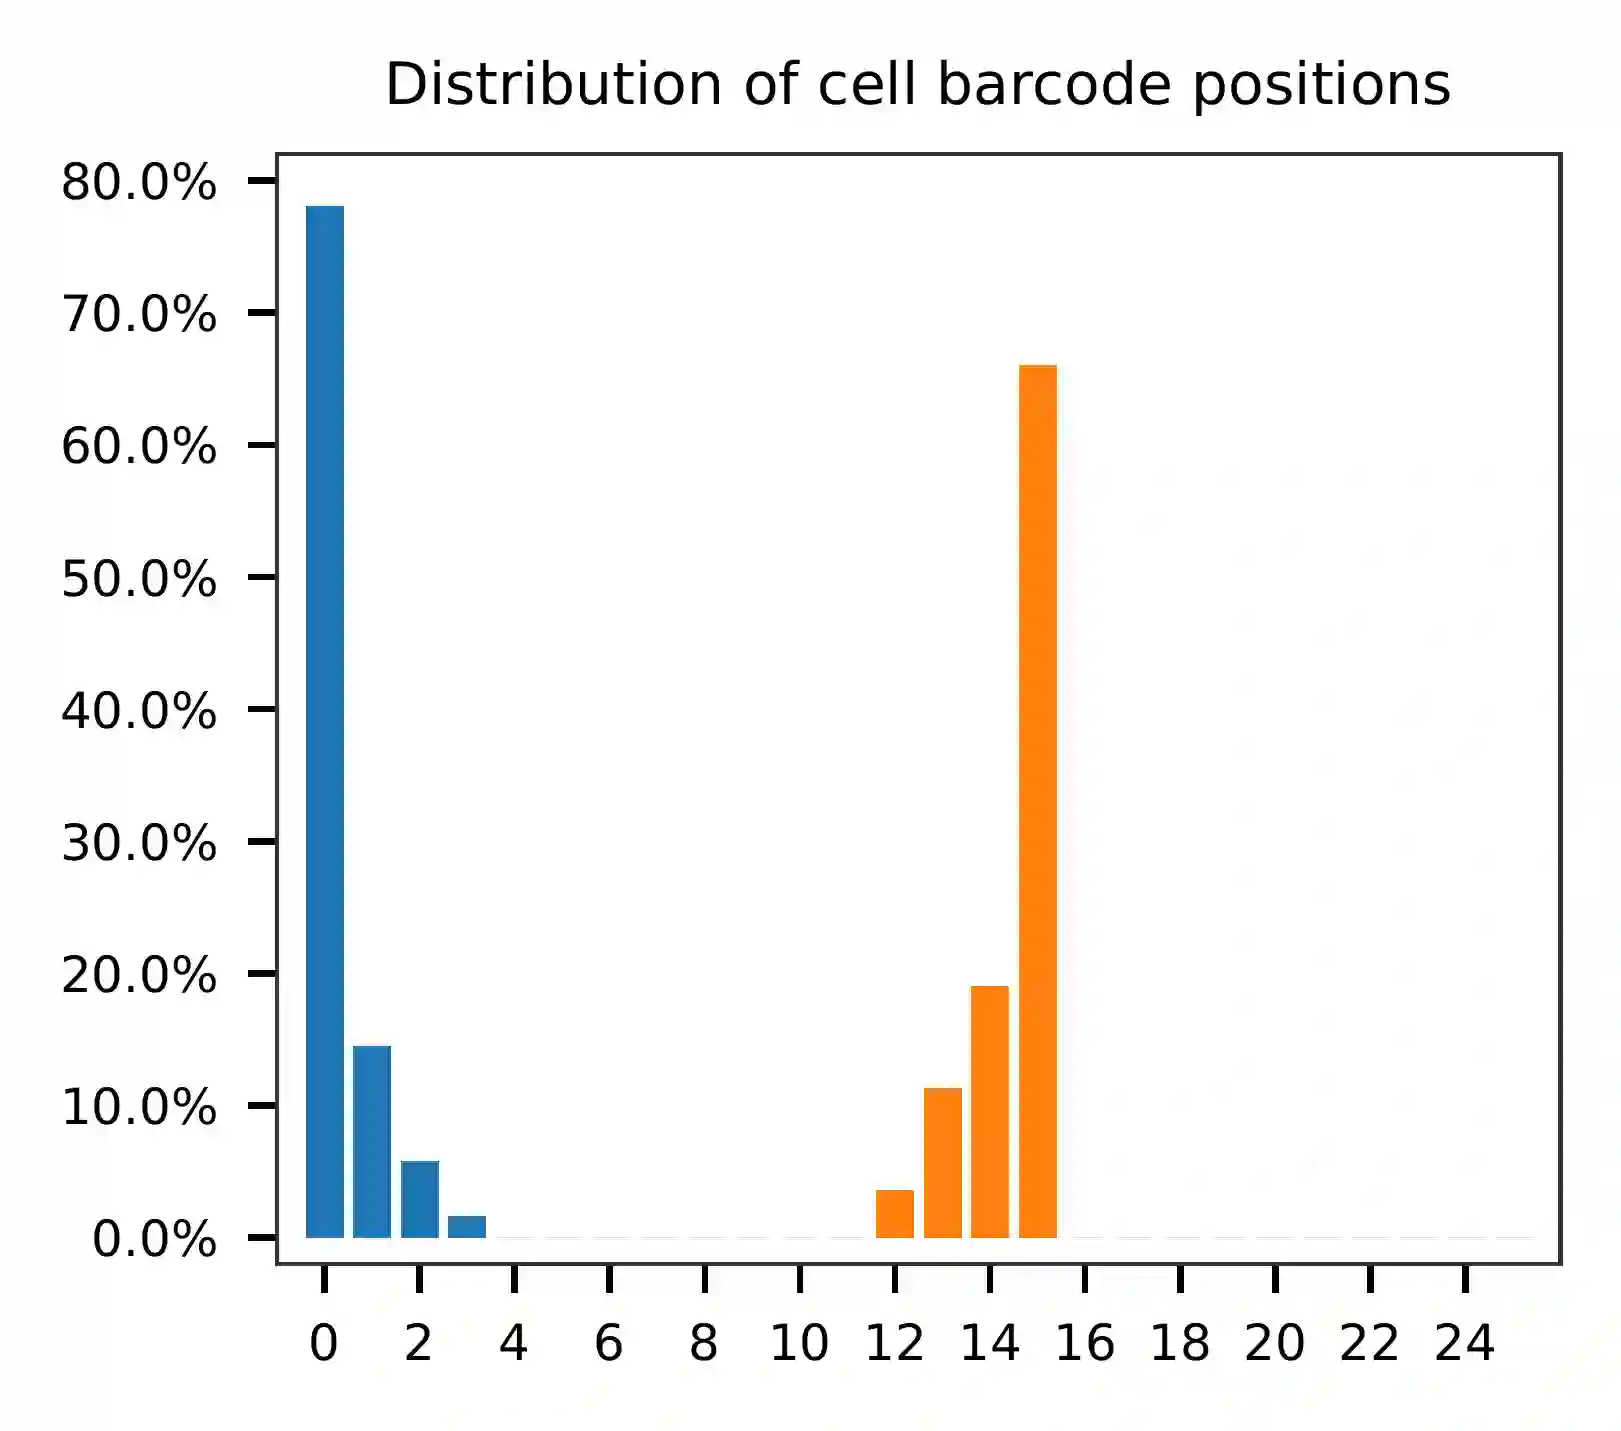
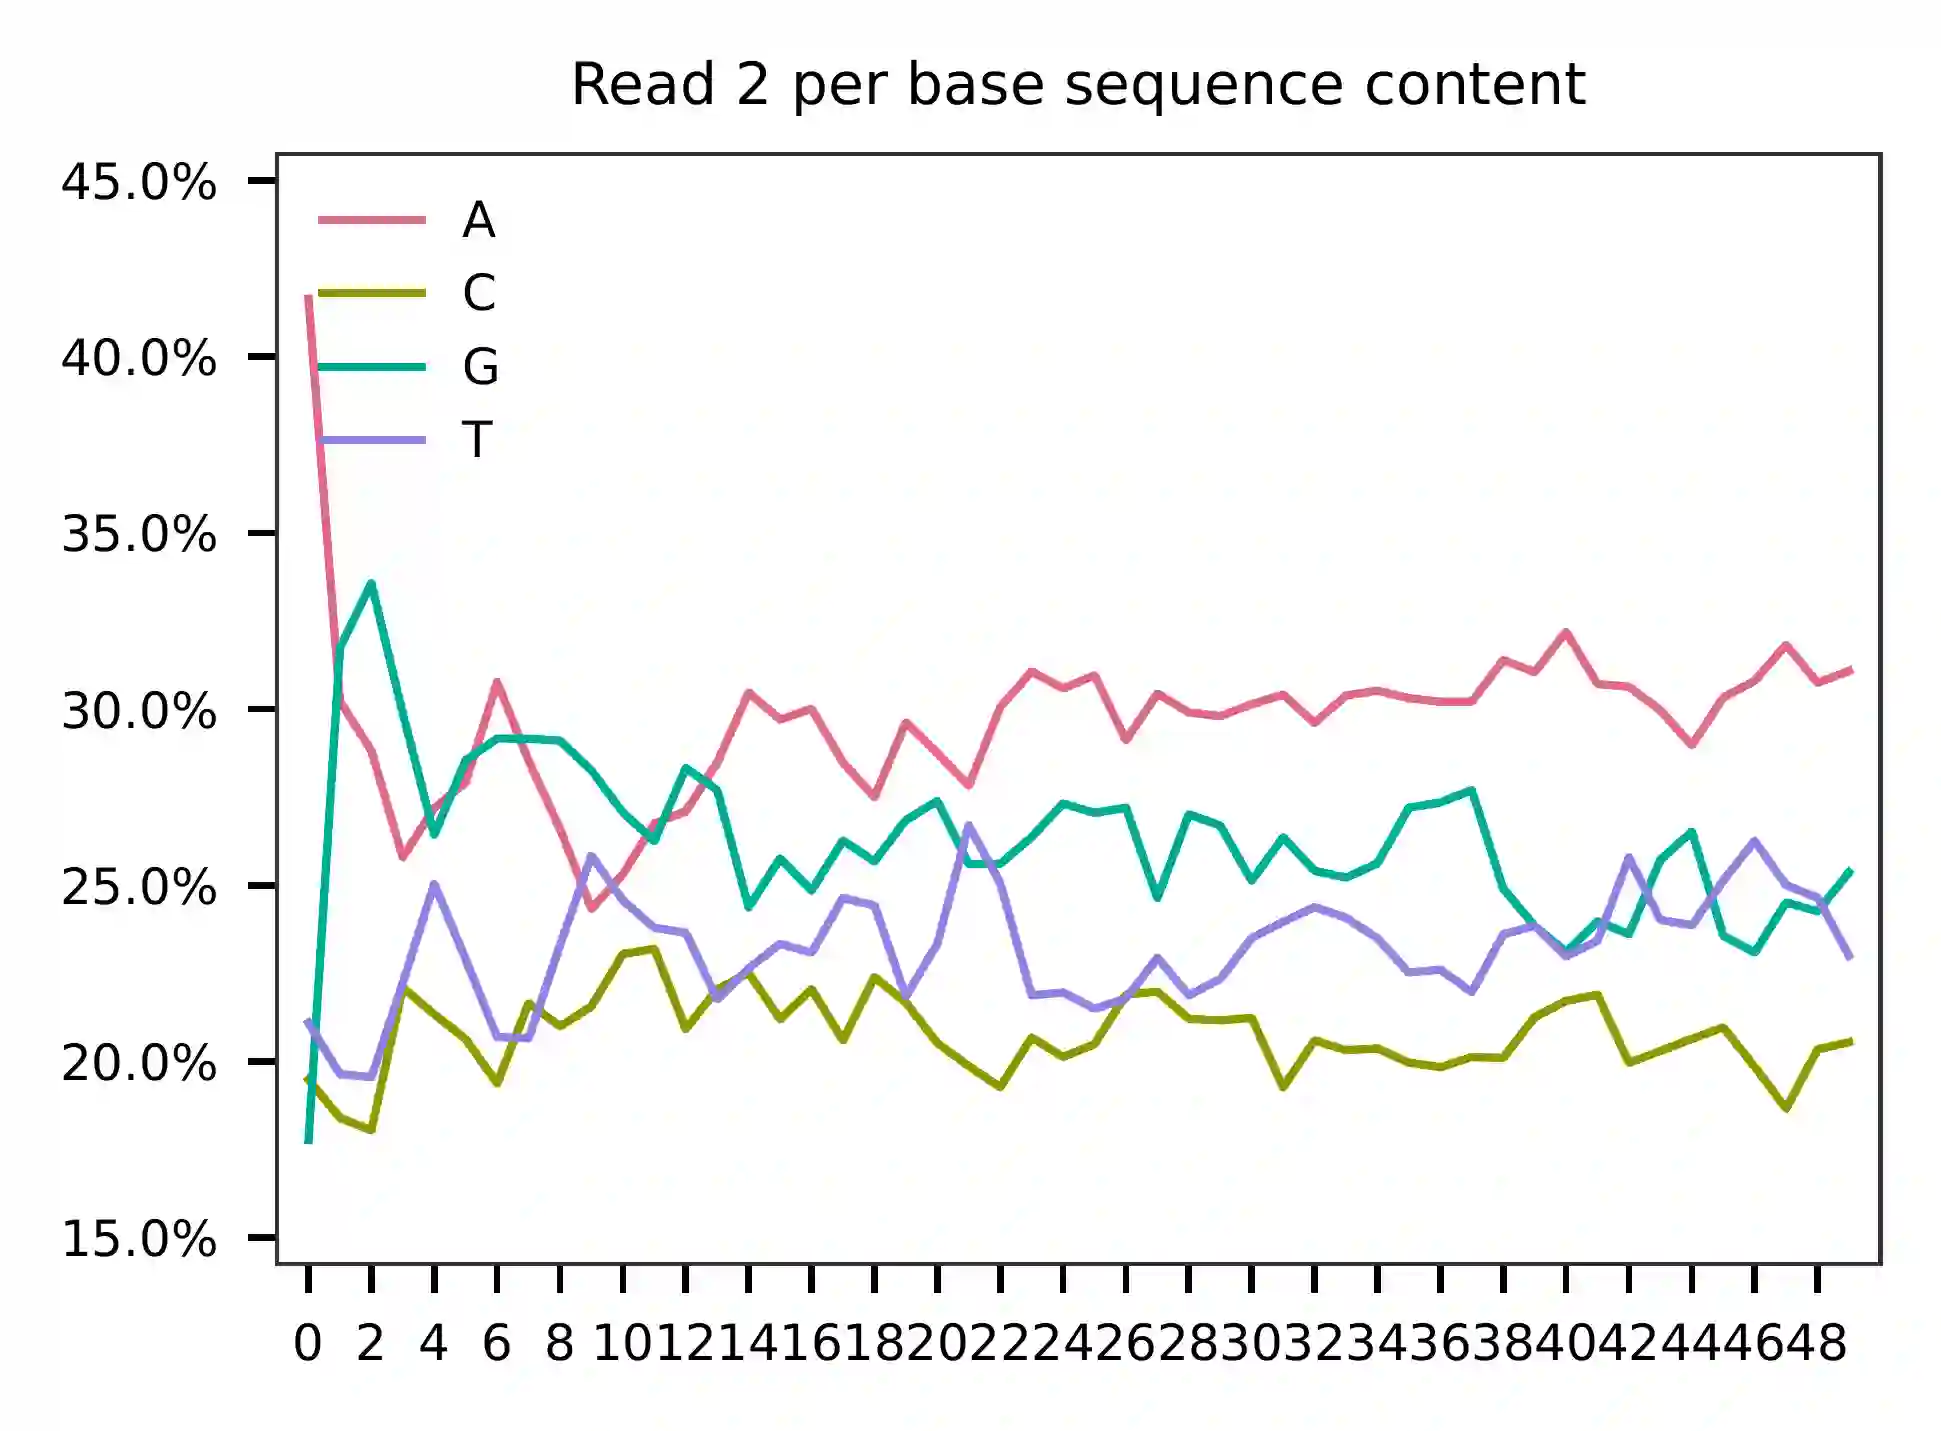
the full length of read 1 and read 2 are searched against reference cell
and feature barcodes, respectively. The per base content of both read
pairs and the distribution of matched barcode positions are summarized.
Use -r1_c and/or -r2_c to limit the search range, and -cb_n
and/or -fb_n to set the mismatch tolerance for cell and/or feature
barcode matching (default 3).
$ fba qc \
    -1 read_1_trimmed.fq.gz \
    -2 read_2_trimmed.fq.gz \
    -w cell_barcodes.txt \
    -f feature_barcodes_UPR_edited.tsv \
    -r1_c 0,16 \
    -n 200000
This library is built using the Chromium Single Cell 3’ Solution v3 and sequenced on Illumina NovaSeq 6000. The first 16 bases are cell barcodes and the following 10 bases are UMIs. Based on the base content plot, the GC content of cell barcodes are quite even. The UMIs are slightly T enriched.
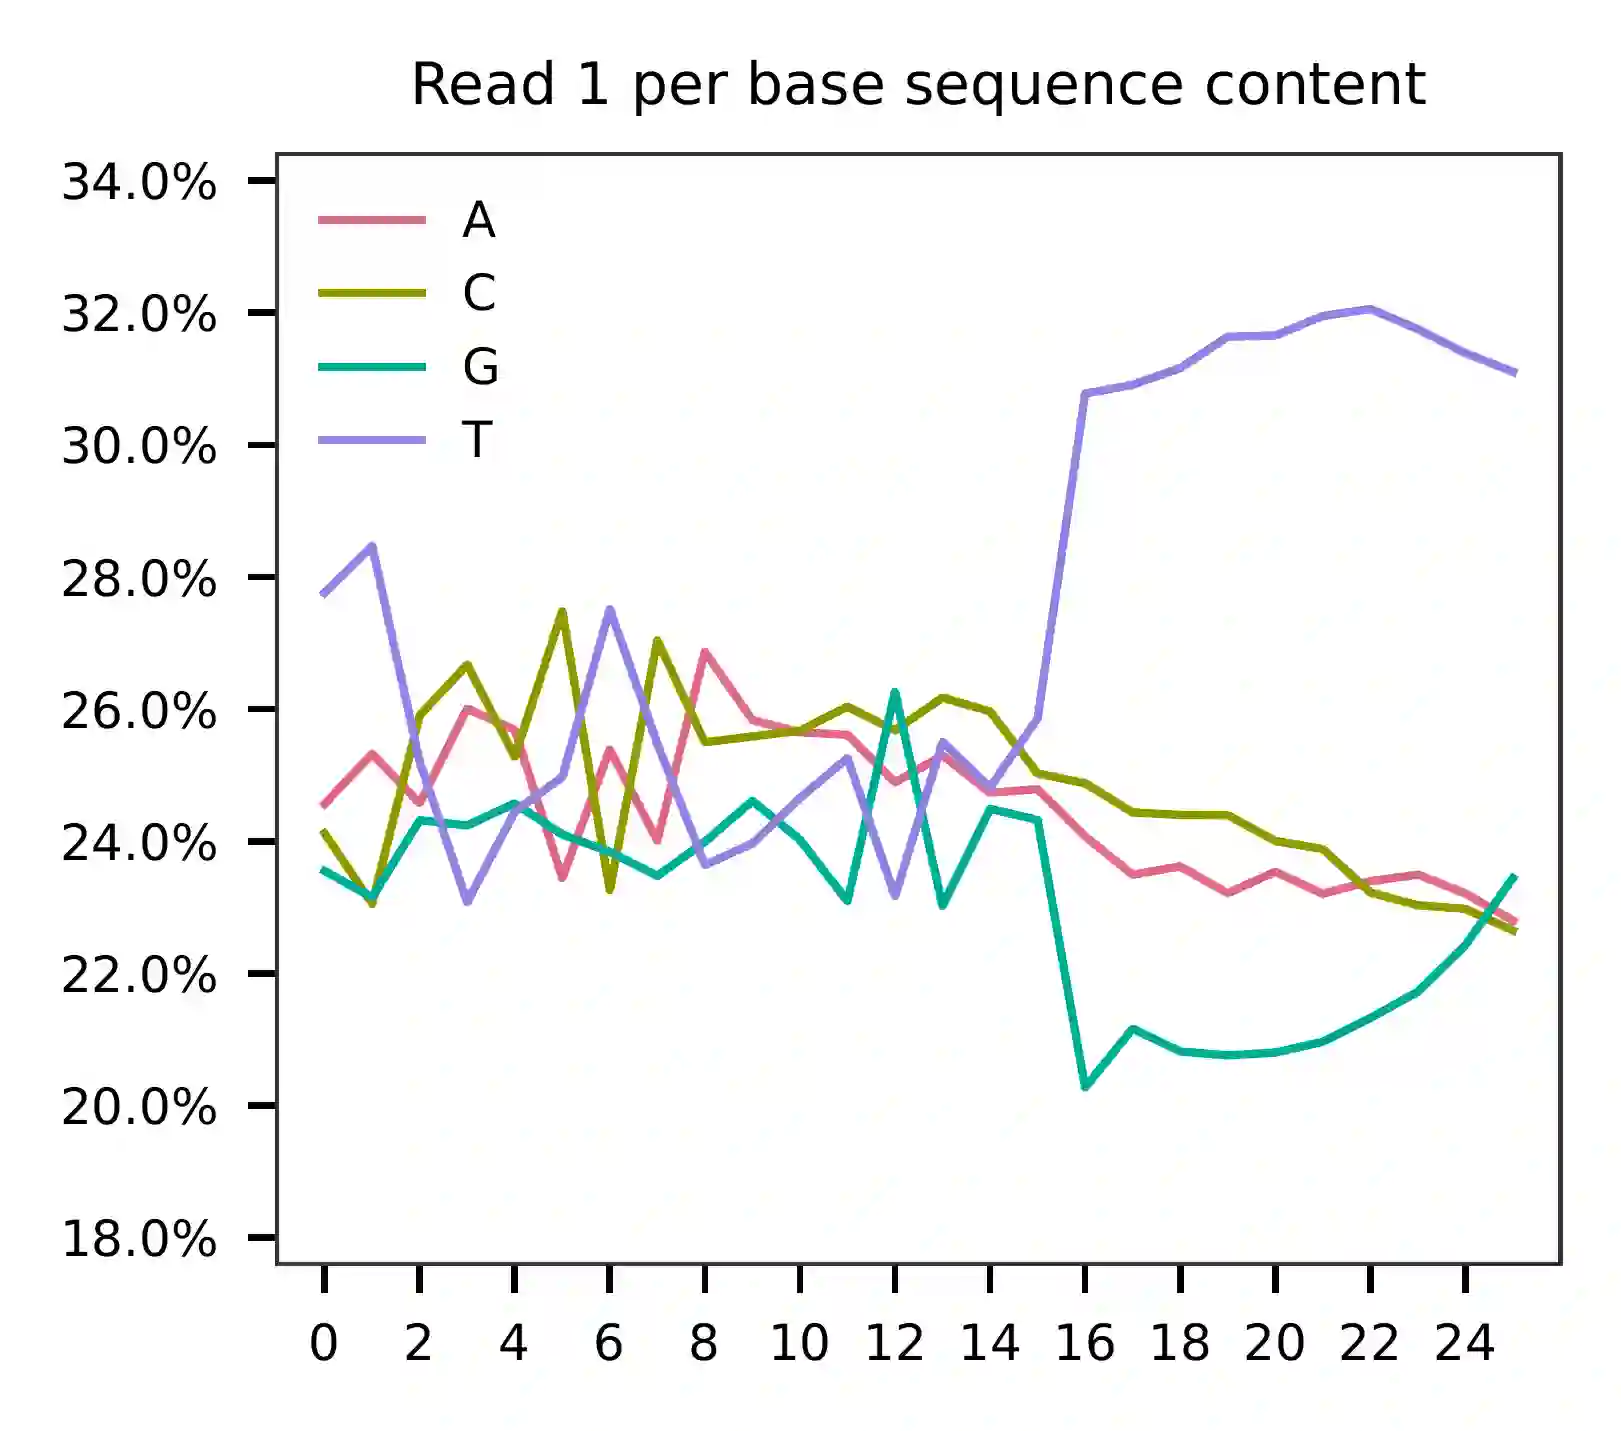
As for read 2, based on the per base content, it suggests that read 2 is slightly A enriched.
The detailed qc results are stored in the
feature_barcoding_output.tsv.gz file. The matching_pos columns
indicate the matched positions on reads, while the
matching_description columns indicate mismatches in the format of
substitutions:insertions:deletions.
$ gzip -dc feature_barcoding_output.tsv.gz | grep -v no_ | head

read1_seq       cell_barcode    cb_matching_pos cb_matching_description read2_seq       feature_barcode fb_matching_pos fb_matching_description
GTGTCCTGTCGCGCATaggacttccg      GTGTCCTCACGCGCAT        0:16    2:0:0   GTGACTCGCAGTAGACGCGGGTTTAAGAGCTAAGCTGGAAACAGCATAGC      UFL1_GTGACTCGCAGTAGACGCG        0:19    0:0:0
CGGAGAAAGACCTGTCggtatgggac      CGGAGAATCACCTGTC        0:16    2:0:0   GGCTTGTTCGCTGGTGGCGTGTTTAAGAGCTAAGCTGGAAACAGCATAGC      OST4_GGCTTGTTCGCTGGTGGCG        0:19    0:0:0
TAGTGCAGTGCATGCCccgaatgttt      TAGTGCAGTGGTATGG        0:15    2:0:1   GGGCCGGAGGACCCGGAGCTAGTTTAAGAGCTAAGCTGGAAACAGCATAG      SCYL1_GGCCGGAGGACCCGGAGCT       1:20    0:0:0
GTCATCCGTTGACTACgggggccact      ATCCTATGTTGACTAC        3:16    0:0:3   GGCTTGTTCGCTGGTGGCGTGTTTAAGAGCTAAGCTGGAAACAGCATAGC      OST4_GGCTTGTTCGCTGGTGGCG        0:19    0:0:0
ATCGCCTCAAGGATATttcagattaa      TCGACCTCAAGAATGT        1:16    2:0:1   GAGCCATGGCAGATTCCTCCGTTTAAGAGCTAAGCTGGAAACAGCATAGC      CARS_GAGCCATGGCAGATTCCTC        0:19    0:0:0
GTTGCGGGTCGCCACAgtacatactt      GTTGCGGCACGCCACA        0:16    2:0:0   GCGGTCCACAAAGGCTCAGAGTTTAAGAGCTAAGCTGGAAACAGCATAGC      DDRGK1_GCGGTCCACAAAGGCTCAG      0:19    0:0:0
TGCATGATCGTGATCGtggagaaagt      AGTGATCAGGTGATCG        3:16    0:0:3   CTCCAGTGCTACGTGTCCCGTTTAAGAGCTAAGCTGGAAACAGCATAGCA      SEC61G_GCTCCAGTGCTACGTGTCC      0:18    0:0:1
CTCCCAAAGCCGTGTTcatcgatatt      CTCCCAAAGACCTTTG        0:14    1:0:2   GTGACTCGCAGTAGACGCGGGTTTAAGAGCTAAGCTGGAAACAGCATAGC      UFL1_GTGACTCGCAGTAGACGCG        0:19    0:0:0
TTTGGTTGTCGACAGAttacgcgttt      TTGGTTTGTCGCACAC        1:15    1:0:2   GACGACTAGTTAGGCGTGTAGTTTAAGAGCTAAGCTGGAAACAGCATAGC      NegCtrl3_GACGACTAGTTAGGCGTGT    0:19    0:0:0
Barcode extraction
Search ranges are set to 0,16 on read 1 and 0,19 on read 2. Two
mismatches for cell and feature barcodes (-cb_m, -cf_m) are
allowed.
$ fba extract \
    -1 read_1_trimmed.fq.gz \
    -2 read_2_trimmed.fq.gz \
    -w cell_barcodes.txt \
    -f feature_barcodes_UPR_edited.tsv \
    -o feature_barcoding_output.tsv.gz \
    -r1_c 0,16 \
    -r2_c 0,19 \
    -cb_m 2 \
    -fb_m 2
Preview of result.
$ gzip -dc feature_barcoding_output.tsv.gz | head

read1_seq       cell_barcode    cb_num_mismatches       read2_seq       feature_barcode fb_num_mismatches
GTGTCCTGTCGCGCATaggacttccg      GTGTCCTCACGCGCAT        2       GTGACTCGCAGTAGACGCGggtttaagagctaagctggaaacagcatagc    UFL1_GTGACTCGCAGTAGACGCG        0
CGGAGAAAGACCTGTCggtatgggac      CGGAGAATCACCTGTC        2       GGCTTGTTCGCTGGTGGCGtgtttaagagctaagctggaaacagcatagc    OST4_GGCTTGTTCGCTGGTGGCG        0
GTTGCGGGTCGCCACAgtacatactt      GTTGCGGCACGCCACA        2       GCGGTCCACAAAGGCTCAGagtttaagagctaagctggaaacagcatagc    DDRGK1_GCGGTCCACAAAGGCTCAG      0
TTTGGTTGTCGACAGAttacgcgttt      TTTGGTTCACGACAGA        2       GACGACTAGTTAGGCGTGTagtttaagagctaagctggaaacagcatagc    NegCtrl3_GACGACTAGTTAGGCGTGT    0
TCGTGGGAGGGAAACGcatggtcgaa      TCGTGGGTCGGAAACG        2       GTCTGGCTGGTCGCACCCGggtttaagagctaagctggaaacagcatagc    MRPL39_GTCTGGCTGGTCGCACCCG      0
ACAGCCGTCTTGCTCAtttaacaggc      ACAGCCGAGTTGCTCA        2       GACCTTGCGTGCAGTTATGtgtttaagagctaagctggaaacagcatagc    DAD1_GACCTTGCGTGCAGTTATG        0
CCGTAGGAGTGCGGCAgccgagcaac      CCGTAGGTCTGCGGCA        2       GACGACTAGTTAGGCGTGTagtttaagagctaagctggaaacagcatagc    NegCtrl3_GACGACTAGTTAGGCGTGT    0
GTCTCACTCAGGACTCtatccatcca      GTCTCACAGAGGACTC        2       GCGAACGCGGCCTGAATTCcgtttaagagctaagctggaaacagcatagc    SRPR_GGCGAACGCGGCCTGAATT        2
AAGACAACATTCGCTCtctaactgca      AAGACAAGTTTCGCTC        2       GAGTCTCCGCAAGGCCCCGggtttaagagctaagctggaaacagcatagc    ATP5B_GAGTCTCCGCAAGGCCCCG       0
Result summary.
52,352,330 out of 104,375,315 read pairs have valid cell and feature barcodes.
2022-03-06 03:44:57,488 - fba.__main__ - INFO - fba version: 0.0.x
2022-03-06 03:44:57,488 - fba.__main__ - INFO - Initiating logging ...
2022-03-06 03:44:57,489 - fba.__main__ - INFO - Python version: 3.10
2022-03-06 03:44:57,489 - fba.__main__ - INFO - Using extract subcommand ...
2022-03-06 03:44:57,504 - fba.levenshtein - INFO - Number of reference cell barcodes: 8,727
2022-03-06 03:44:57,504 - fba.levenshtein - INFO - Number of reference feature barcodes: 32
2022-03-06 03:44:57,504 - fba.levenshtein - INFO - Read 1 coordinates to search: [0, 16)
2022-03-06 03:44:57,504 - fba.levenshtein - INFO - Read 2 coordinates to search: [0, 19)
2022-03-06 03:44:57,504 - fba.levenshtein - INFO - Cell barcode maximum number of mismatches: 2
2022-03-06 03:44:57,504 - fba.levenshtein - INFO - Feature barcode maximum number of mismatches: 2
2022-03-06 03:44:57,504 - fba.levenshtein - INFO - Read 1 maximum number of N allowed: 3
2022-03-06 03:44:57,504 - fba.levenshtein - INFO - Read 2 maximum number of N allowed: 3
2022-03-06 03:44:58,965 - fba.levenshtein - INFO - Matching ...
2022-03-06 04:02:50,201 - fba.levenshtein - INFO - Read pairs processed: 10,000,000
2022-03-06 04:21:17,938 - fba.levenshtein - INFO - Read pairs processed: 20,000,000
2022-03-06 04:40:47,371 - fba.levenshtein - INFO - Read pairs processed: 30,000,000
2022-03-06 05:00:15,184 - fba.levenshtein - INFO - Read pairs processed: 40,000,000
2022-03-06 05:19:43,813 - fba.levenshtein - INFO - Read pairs processed: 50,000,000
2022-03-06 05:39:14,583 - fba.levenshtein - INFO - Read pairs processed: 60,000,000
2022-03-06 05:58:41,750 - fba.levenshtein - INFO - Read pairs processed: 70,000,000
2022-03-06 06:18:09,714 - fba.levenshtein - INFO - Read pairs processed: 80,000,000
2022-03-06 06:37:33,602 - fba.levenshtein - INFO - Read pairs processed: 90,000,000
2022-03-06 06:56:58,484 - fba.levenshtein - INFO - Read pairs processed: 100,000,000
2022-03-06 07:05:24,748 - fba.levenshtein - INFO - Number of read pairs processed: 104,375,315
2022-03-06 07:05:24,771 - fba.levenshtein - INFO - Number of read pairs w/ valid barcodes: 52,352,330
2022-03-06 07:05:24,834 - fba.__main__ - INFO - Done.
Matrix generation
Only fragments with correctly matched cell and feature barcodes are
included, while fragments with UMI lengths less than the specified value
are discarded. UMI removal is performed using UMI-tools (Smith, T., et
al. 2017. Genome Res. 27, 491–499.), with the starting position on
read 1 set by -us (default 16) and the length set by -ul
(default 12). The UMI deduplication method can be set using -ud
(default directional), and the UMI deduplication mismatch threshold
can be specified using -um (default 1).
The generated feature count matrix can be easily imported into well-established single cell analysis packages: Seurat and Scanpy.
$ fba count \
    -i feature_barcoding_output.tsv.gz \
    -o matrix_featurecount.csv.gz \
    -us 16 \
    -ul 10
Result summary.
10.7% (5,581,448 out of 52,352,330) of read pairs with valid cell and feature barcodes are unique fragments. 1.4% (5,581,448 out of 404,963,129) of total sequenced read pairs contribute to the final matrix. The meidan number of UMIs of sgRNA per cell is 413.0.
2022-03-06 07:05:24,972 - fba.__main__ - INFO - fba version: 0.0.x
2022-03-06 07:05:24,973 - fba.__main__ - INFO - Initiating logging ...
2022-03-06 07:05:24,973 - fba.__main__ - INFO - Python version: 3.10
2022-03-06 07:05:24,973 - fba.__main__ - INFO - Using count subcommand ...
2022-03-06 07:05:26,523 - fba.count - INFO - UMI-tools version: 1.1.2
2022-03-06 07:05:26,525 - fba.count - INFO - UMI starting position on read 1: 16
2022-03-06 07:05:26,526 - fba.count - INFO - UMI length: 10
2022-03-06 07:05:26,526 - fba.count - INFO - UMI-tools deduplication threshold: 1
2022-03-06 07:05:26,526 - fba.count - INFO - UMI-tools deduplication method: directional
2022-03-06 07:05:26,526 - fba.count - INFO - Header line: read1_seq cell_barcode cb_num_mismatches read2_seq feature_barcode fb_num_mismatches
2022-03-06 07:06:52,385 - fba.count - INFO - Number of lines processed: 52,352,330
2022-03-06 07:06:52,394 - fba.count - INFO - Number of cell barcodes detected: 8,670
2022-03-06 07:06:52,394 - fba.count - INFO - Number of features detected: 32
2022-03-06 07:11:58,774 - fba.count - INFO - Total UMIs after deduplication: 5,581,448
2022-03-06 07:11:58,776 - fba.count - INFO - Median number of UMIs per cell: 413.0
2022-03-06 07:11:59,297 - fba.__main__ - INFO - Done.
Demultiplexing
Poisson-Gaussian mixture model
The implementation of demultiplexing method 3 (set by -dm) is
inspired by Replogle, M., et al. (2021). To set the probability
threshold for demultiplexing, use -p (default 0.9). To specify
the minimum number of positive cells for a given feature to be
considered during demultiplexing, use -nc (default 200).
$ fba demultiplex \
    -i matrix_featurecount.csv.gz \
    -dm 3 \
    -v \
    -nc 0
2022-03-06 14:07:02,328 - fba.__main__ - INFO - fba version: 0.0.x
2022-03-06 14:07:02,328 - fba.__main__ - INFO - Initiating logging ...
2022-03-06 14:07:02,328 - fba.__main__ - INFO - Python version: 3.9
2022-03-06 14:07:02,328 - fba.__main__ - INFO - Using demultiplex subcommand ...
2022-03-06 14:07:04,814 - fba.__main__ - INFO - Skipping arguments: "-q/--quantile", "-cm/--clustering_method"
2022-03-06 14:07:04,814 - fba.demultiplex - INFO - Output directory: demultiplexed
2022-03-06 14:07:04,814 - fba.demultiplex - INFO - Demultiplexing method: 3
2022-03-06 14:07:04,814 - fba.demultiplex - INFO - UMI normalization method: clr
2022-03-06 14:07:04,814 - fba.demultiplex - INFO - Visualization: On
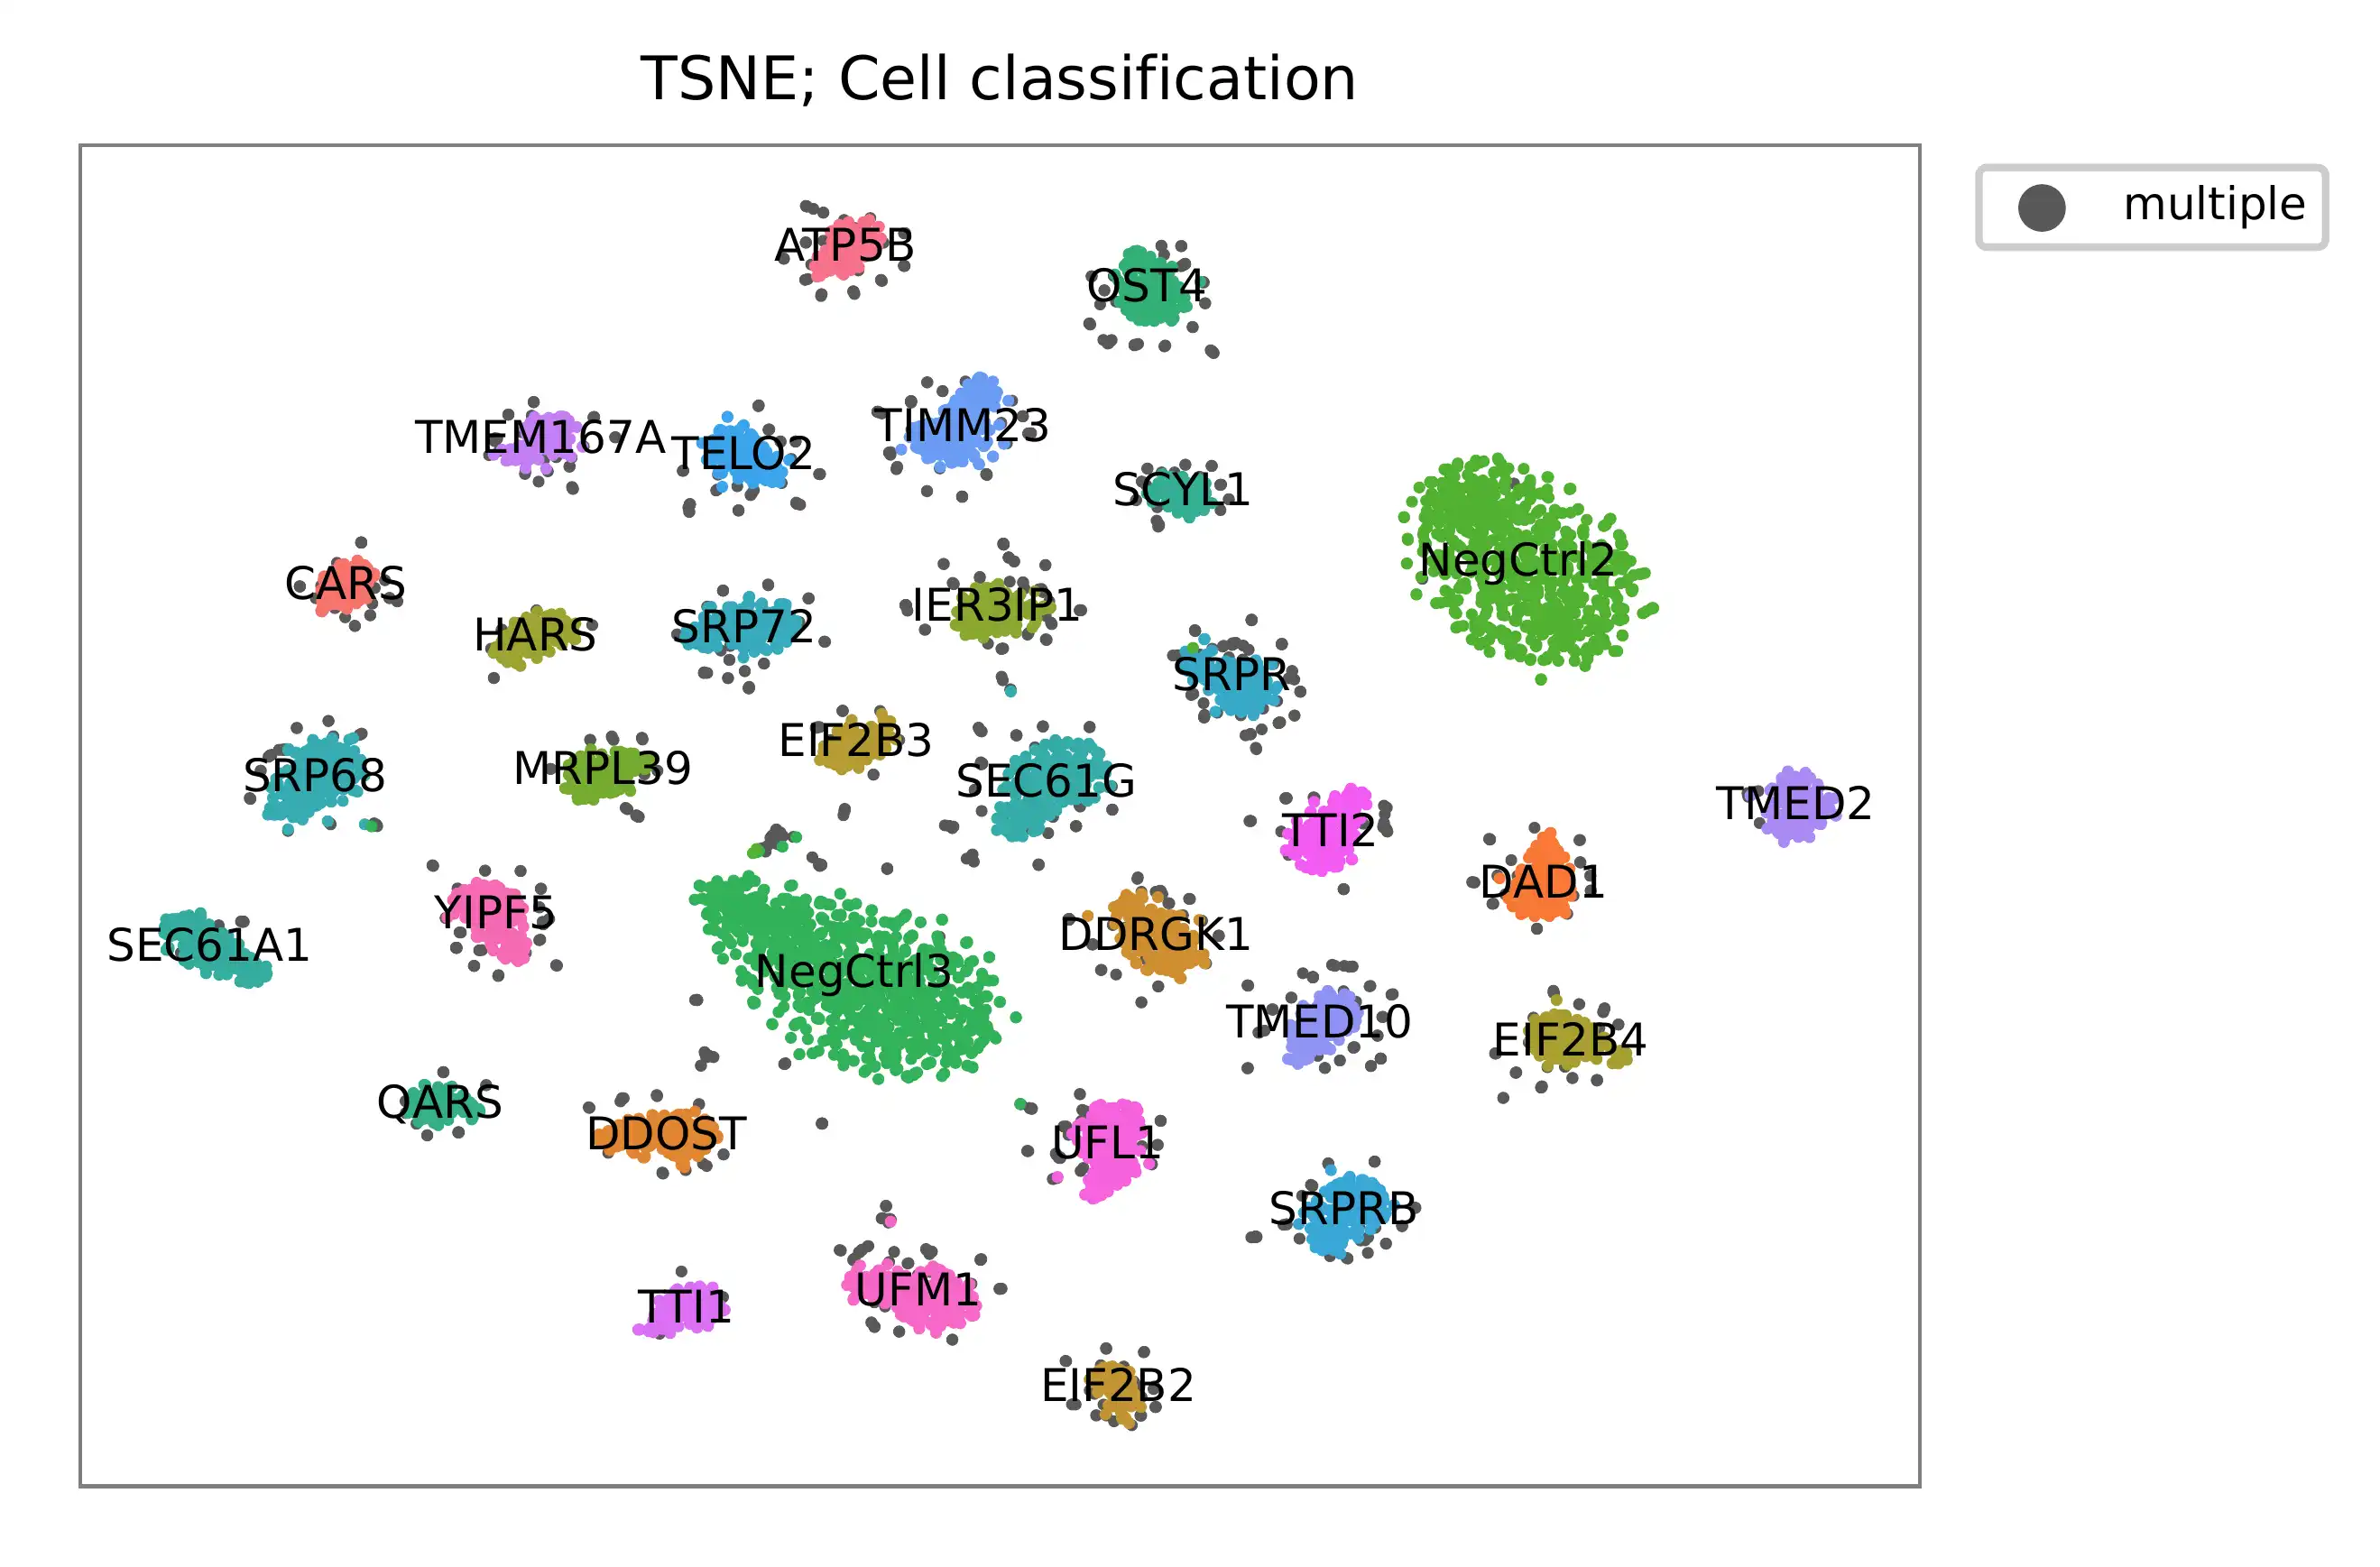
2022-03-06 14:07:04,814 - fba.demultiplex - INFO - Visualization method: tsne
2022-03-06 14:07:04,814 - fba.demultiplex - INFO - Loading feature count matrix: matrix_featurecount.csv.gz ...
2022-03-06 14:07:04,902 - fba.demultiplex - INFO - Number of cells: 8,670
2022-03-06 14:07:04,902 - fba.demultiplex - INFO - Number of positive cells for a feature to be included: 0
2022-03-06 14:07:04,916 - fba.demultiplex - INFO - Number of features: 32 / 32 (after filtering / original in the matrix)
2022-03-06 14:07:04,935 - fba.demultiplex - INFO - Features: ATP5B CARS DAD1 DDOST DDRGK1 EIF2B2 EIF2B3 EIF2B4 HARS IER3IP1 MRPL39 NegCtrl2 NegCtrl3 OST4 QARS SCYL1 SEC61A1 SEC61G SRP68 SRP72 SRPRB SRPR TELO2 TIMM23 TMED10 TMED2 TMEM167A TTI1 TTI2 UFL1 UFM1 YIPF5
2022-03-06 14:07:04,935 - fba.demultiplex - INFO - Total UMIs: 5,581,448 / 5,581,448
2022-03-06 14:07:04,943 - fba.demultiplex - INFO - Median number of UMIs per cell: 413.0 / 413.0
2022-03-06 14:07:04,957 - fba.demultiplex - INFO - Demultiplexing ...
2022-03-06 14:07:47,811 - fba.demultiplex - INFO - Generating heatmap ...
2022-03-06 14:07:57,340 - fba.demultiplex - INFO - Embedding ...
2022-03-06 14:08:12,180 - fba.__main__ - INFO - Done.
Heatmap of the relative abundance of features (sgRNAs) across all cells. Each column represents a single cell.
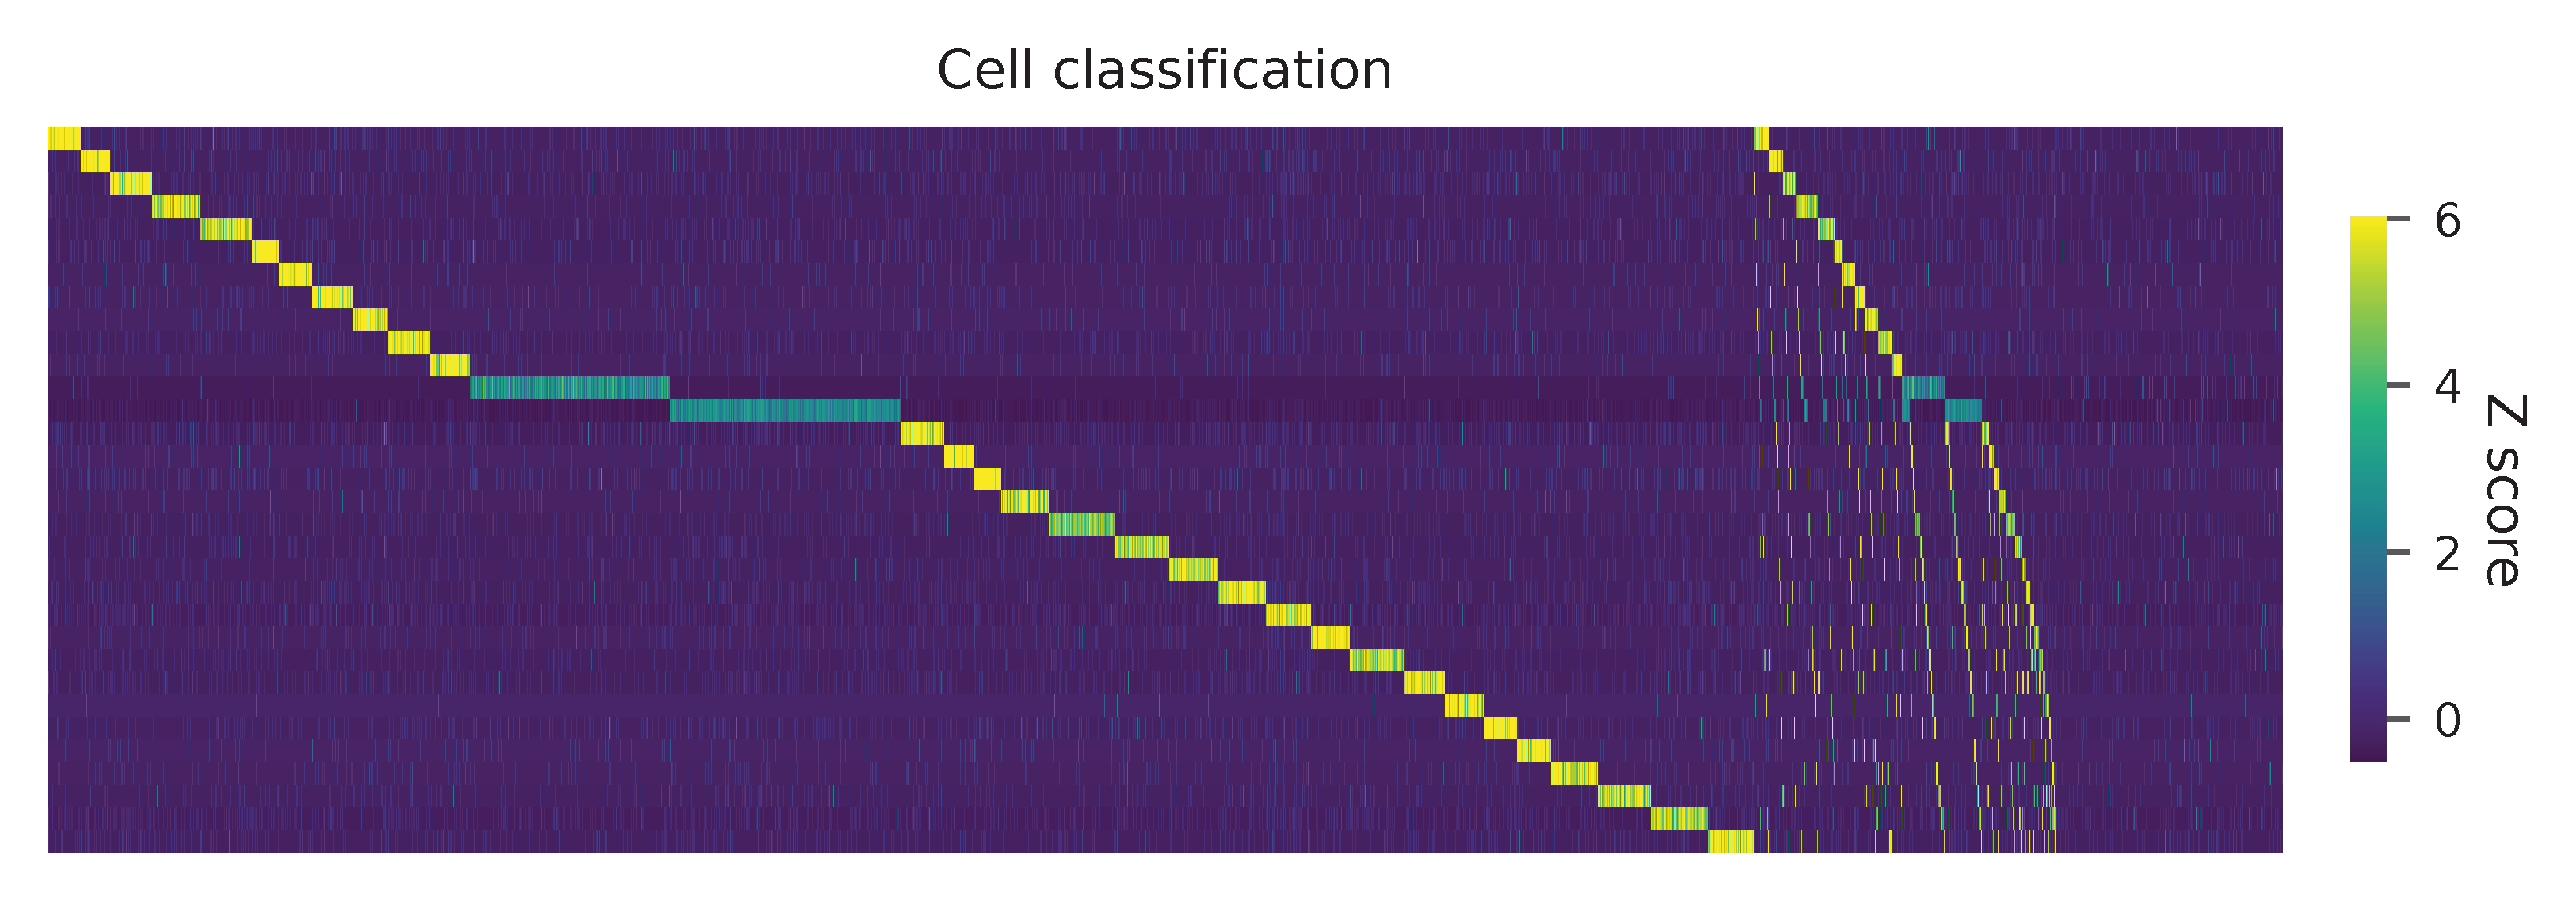
Preview the demultiplexing result (Fig. 2d, middle column): the numbers of singlets, multiplets and negatives are 6,618 (76.3%), 1,171 (13.5%), and 881 (10.1%), respectively.
In [1]: import pandas as pd

In [2]: m = pd.read_csv("demultiplexed/matrix_cell_identity.csv.gz", index_col=0)

In [3]: m.loc[:, m.sum(axis=0) == 1].sum(axis=1)
Out[3]:
ATP5B       130
CARS        115
DAD1        163
DDOST       186
DDRGK1      200
EIF2B2      104
EIF2B3      129
EIF2B4      160
HARS        136
IER3IP1     162
MRPL39      153
NegCtrl2    777
NegCtrl3    898
OST4        167
QARS        113
SCYL1       108
SEC61A1     183
SEC61G      256
SRP68       212
SRP72       191
SRPRB       184
SRPR        175
TELO2       152
TIMM23      211
TMED10      156
TMED2       152
TMEM167A    127
TTI1        132
TTI2        183
UFL1        204
UFM1        223
YIPF5       176
dtype: int64

In [4]: sum(m.sum(axis=0) == 1)
Out[4]: 6618

In [5]: sum(m.sum(axis=0) > 1)
Out[5]: 1171

In [6]: sum(m.sum(axis=0) == 0)
Out[6]: 881

In [7]: m.shape
Out[7]: (32, 8670)
t-SNE embedding of cells based on the abundance of features (sgRNAs, no transcriptome information used). Colors indicate the sgRNA status for each cell, as called by FBA.