30k Mouse E18 Combined Cortex, Hippocampus and Subventricular Zone Nuclei Multiplexed
Dataset: 30k Mouse E18 Combined Cortex, Hippocampus and Subventricular Zone Nuclei Multiplexed, 12 CMOs
The detailed description of this dataset can be found here.
Note
The processing of QC, barcode extraction and matrix generation is similar to 10k 1:1 Mixture of Raji and Jurkat Cells Multiplexed, 2 CMOs.
Demultiplexing
In summary, 799,808,703 of total 1,238,424,843 read pairs have the valid
structure (-cb_m 2, -fb_m 1). The average UMIs per cell is
22,962.0 for this feature barcode library.
Inspect feature count matrix.
In [1]: import pandas as pd

In [2]: m = pd.read_csv("matrix_featurecount.csv.gz", index_col=0)

In [3]: m.shape
Out[3]: (12, 59342)

In [4]: m.sum(axis=1)
Out[4]:
CMO301_ATGAGGAATTCCTGC     90849728
CMO302_CATGCCAATAGAGCG     73859662
CMO303_CCGTCGTCCAAGCAT     94388625
CMO304_AACGTTAATCACTCA    112458502
CMO305_CGCGATATGGTCGGA     57147183
CMO306_AAGATGAGGTCTGTG     67979145
CMO307_AAGCTCGTTGGAAGA    191026854
CMO308_CGGATTCCACATCAT     97445798
CMO309_GTTGATCTATAACAG    189936250
CMO310_GCAGGAGGTATCAAT    130990984
CMO311_GAATCGTGATTCTTC    131131183
CMO312_ACATGGTCAACGCTG     55103315
dtype: int64

In [5]: (m > 0).sum(axis=1)
Out[5]:
CMO301_ATGAGGAATTCCTGC    59128
CMO302_CATGCCAATAGAGCG    59088
CMO303_CCGTCGTCCAAGCAT    59096
CMO304_AACGTTAATCACTCA    59194
CMO305_CGCGATATGGTCGGA    58794
CMO306_AAGATGAGGTCTGTG    58932
CMO307_AAGCTCGTTGGAAGA    59306
CMO308_CGGATTCCACATCAT    59078
CMO309_GTTGATCTATAACAG    59292
CMO310_GCAGGAGGTATCAAT    59202
CMO311_GAATCGTGATTCTTC    59204
CMO312_ACATGGTCAACGCTG    58836
dtype: int64
Gaussian mixture model
Cells are demulitplexed based on the feature count matrix (CMO
abundance). Demultiplexing method 2 (set by -dm) is inspired by
the method described on 10x Genomics’ website. A cell identity matrix
is generated in the output directory: 0 means negative, 1 means
positive. To set normalization method, use -nm (default clr). To
set the probability threshold for demultiplexing, use -p (default
0.9). To generate visualization plots, set -v. To choose
visualization method, use -vm (default tsne).
$ fba demultiplex \
    -i matrix_featurecount.csv.gz \
    --output_directory demultiplexed \
    -dm 2 \
    -v
2021-10-05 20:45:58,069 - fba.__main__ - INFO - fba version: 0.0.x
2021-10-05 20:45:58,069 - fba.__main__ - INFO - Initiating logging ...
2021-10-05 20:45:58,069 - fba.__main__ - INFO - Python version: 3.8
2021-10-05 20:45:58,069 - fba.__main__ - INFO - Using demultiplex subcommand ...
2021-10-05 20:46:17,903 - fba.__main__ - INFO - Skipping arguments: "-q/--quantile", "-cm/--clustering_method"
2021-10-05 20:46:17,903 - fba.demultiplex - INFO - Output directory: demultiplexed
2021-10-05 20:46:17,903 - fba.demultiplex - INFO - Demultiplexing method: 2
2021-10-05 20:46:17,903 - fba.demultiplex - INFO - UMI normalization method: clr
2021-10-05 20:46:17,903 - fba.demultiplex - INFO - Visualization: On
2021-10-05 20:46:17,903 - fba.demultiplex - INFO - Visualization method: tsne
2021-10-05 20:46:17,903 - fba.demultiplex - INFO - Loading feature count matrix: matrix_featurecount.csv.gz ...
2021-10-05 20:46:27,051 - fba.demultiplex - INFO - Number of cells: 31,171
2021-10-05 20:46:27,052 - fba.demultiplex - INFO - Number of positive cells for a feature to be included: 200
2021-10-05 20:46:27,163 - fba.demultiplex - INFO - Number of features: 12 / 12 (after filtering / original in the matrix)
2021-10-05 20:46:27,163 - fba.demultiplex - INFO - Features: CMO301 CMO302 CMO303 CMO304 CMO305 CMO306 CMO307 CMO308 CMO309 CMO310 CMO311 CMO312
2021-10-05 20:46:27,164 - fba.demultiplex - INFO - Total UMIs: 713,913,321 / 713,913,321
2021-10-05 20:46:27,218 - fba.demultiplex - INFO - Median number of UMIs per cell: 22,962.0 / 22,962.0
2021-10-05 20:46:27,218 - fba.demultiplex - INFO - Demultiplexing ...
2021-10-05 20:46:29,001 - fba.demultiplex - INFO - Generating heatmap ...
2021-10-05 20:47:17,305 - fba.demultiplex - INFO - Embedding ...
2021-10-05 20:49:27,083 - fba.__main__ - INFO - Done.
According to the description of this dataset:
The four E18 mouse nuclei samples were multiplexed at equal proportions with 3 CMOs per nuclei sample, resulting in a pooled sample labeled with 12 CMOs. Nuclei from the non-multiplexed sample were used as one of the four sample types composing the multiplexed sample.
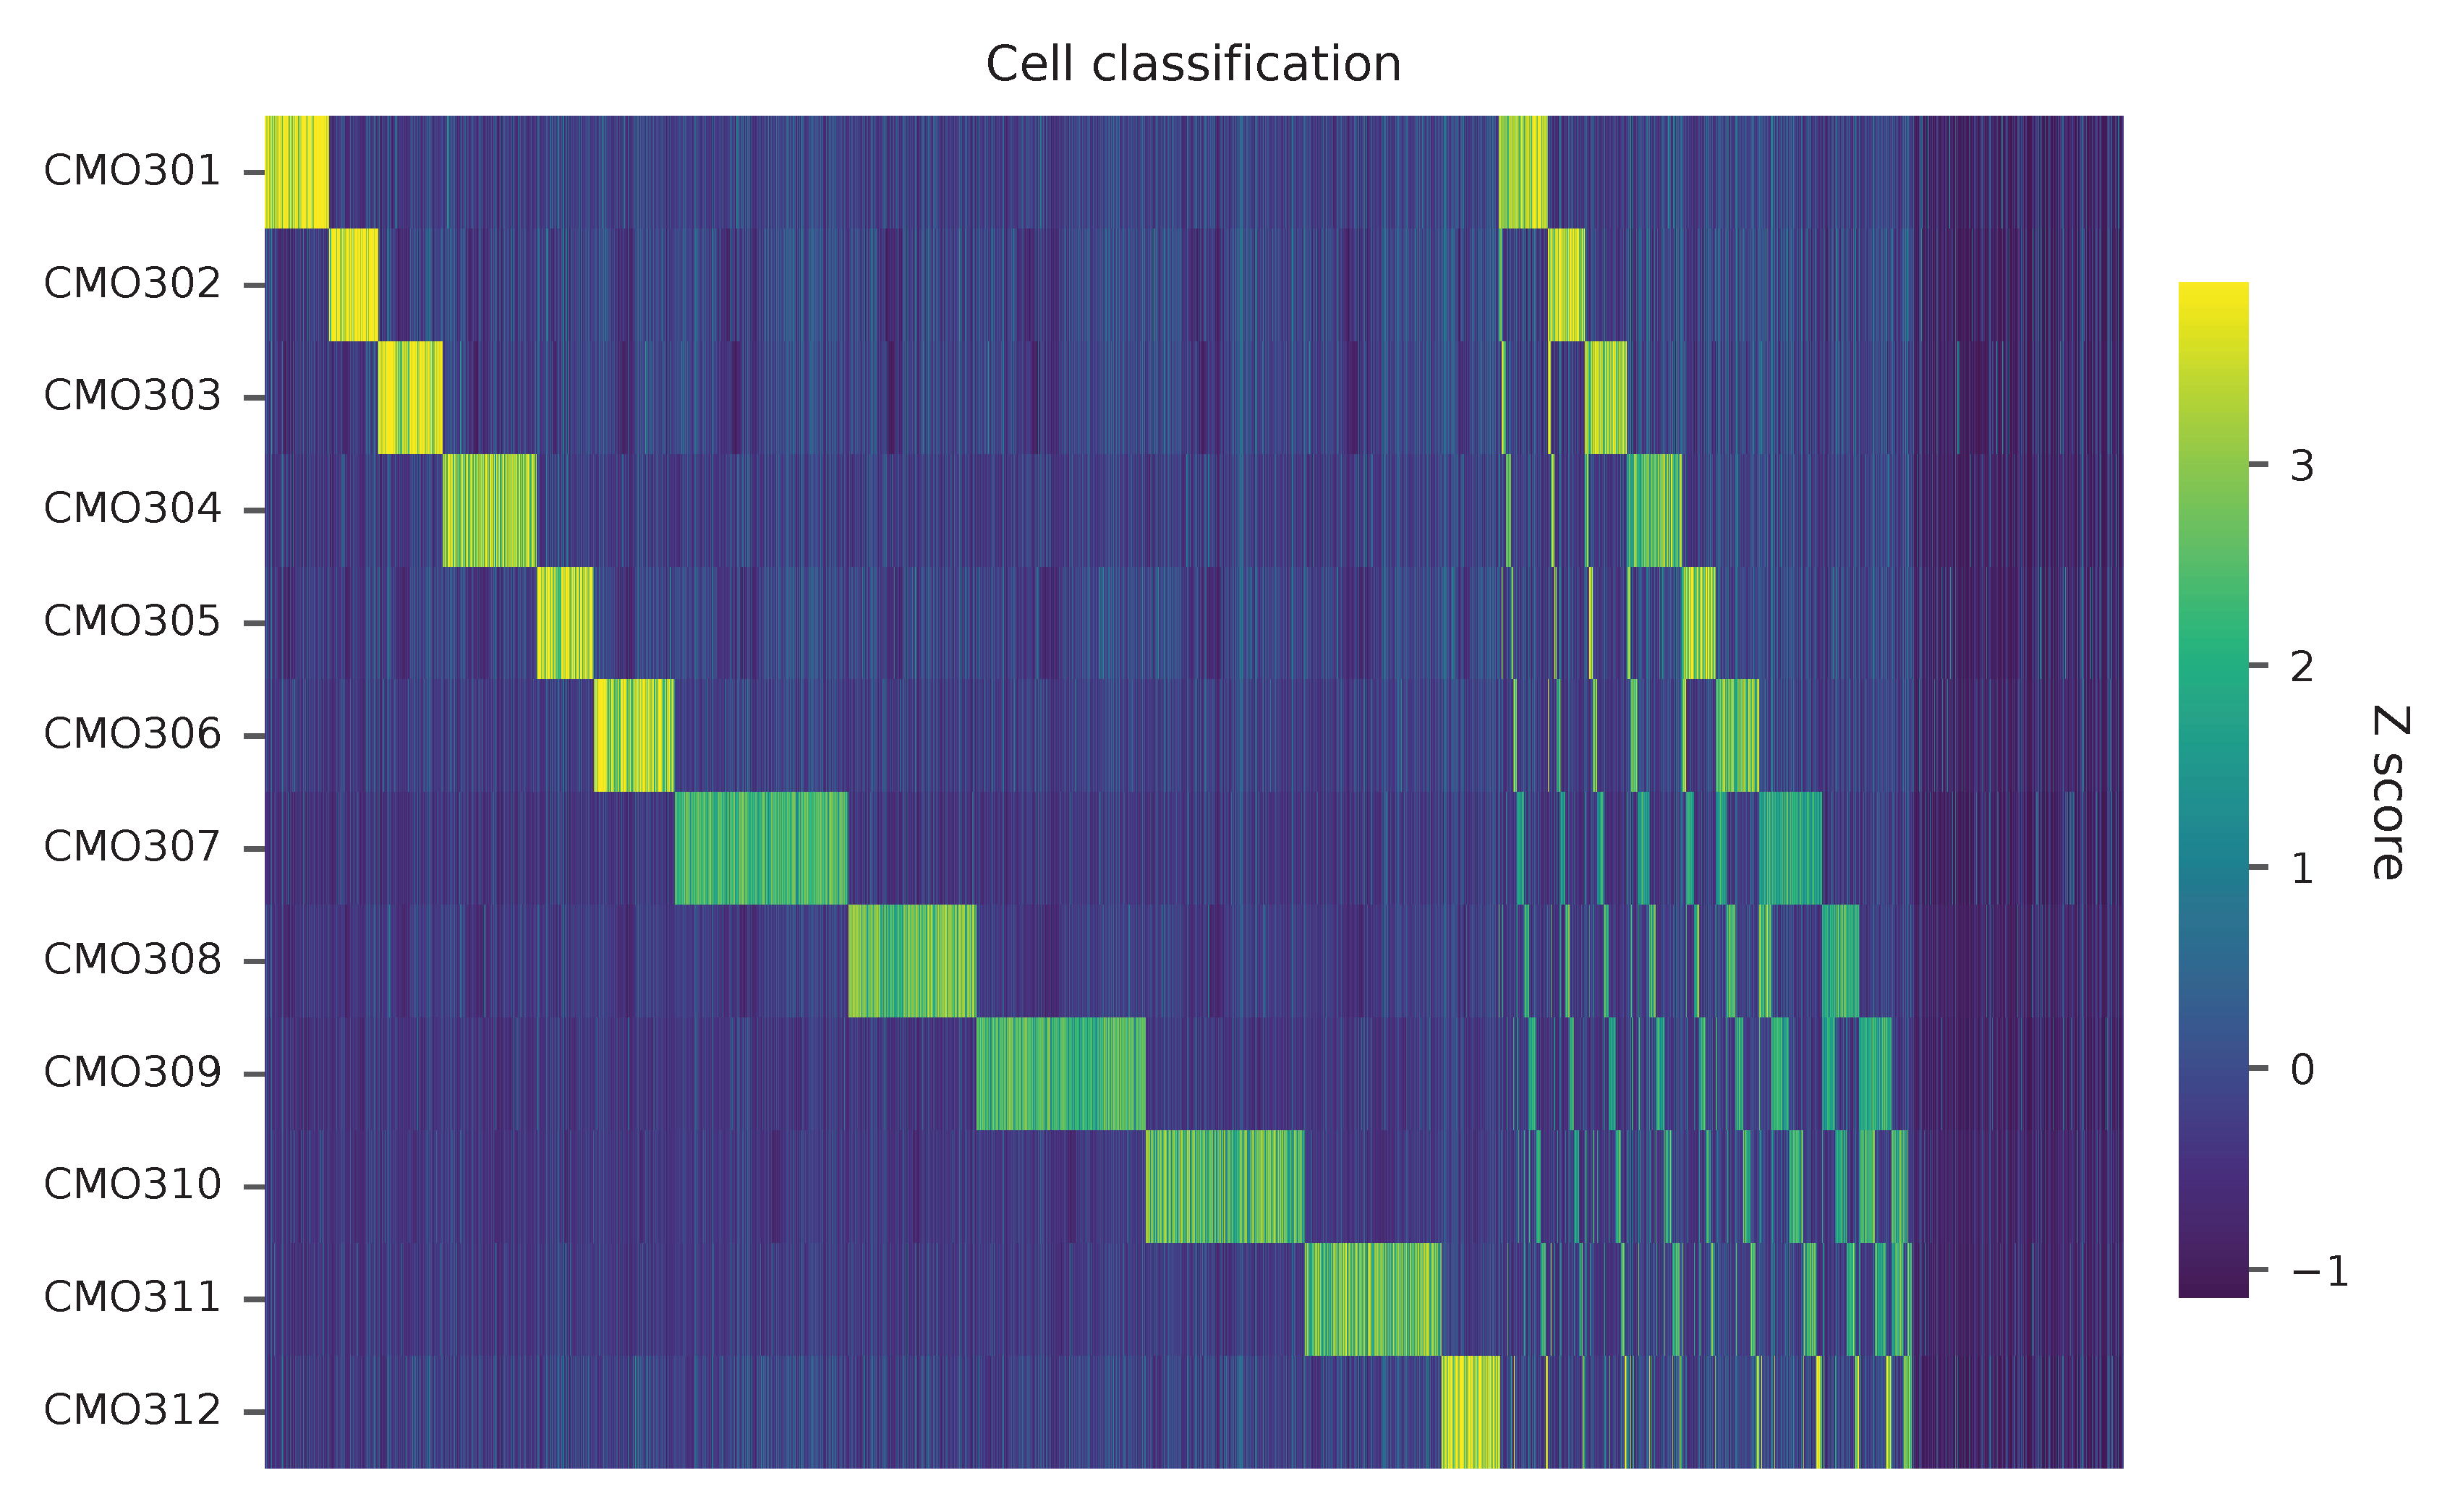
Heatmap of the relative abundance of features (CMOs) across all cells. Each column represents a single cell. Multiplets have more than one CMOs.
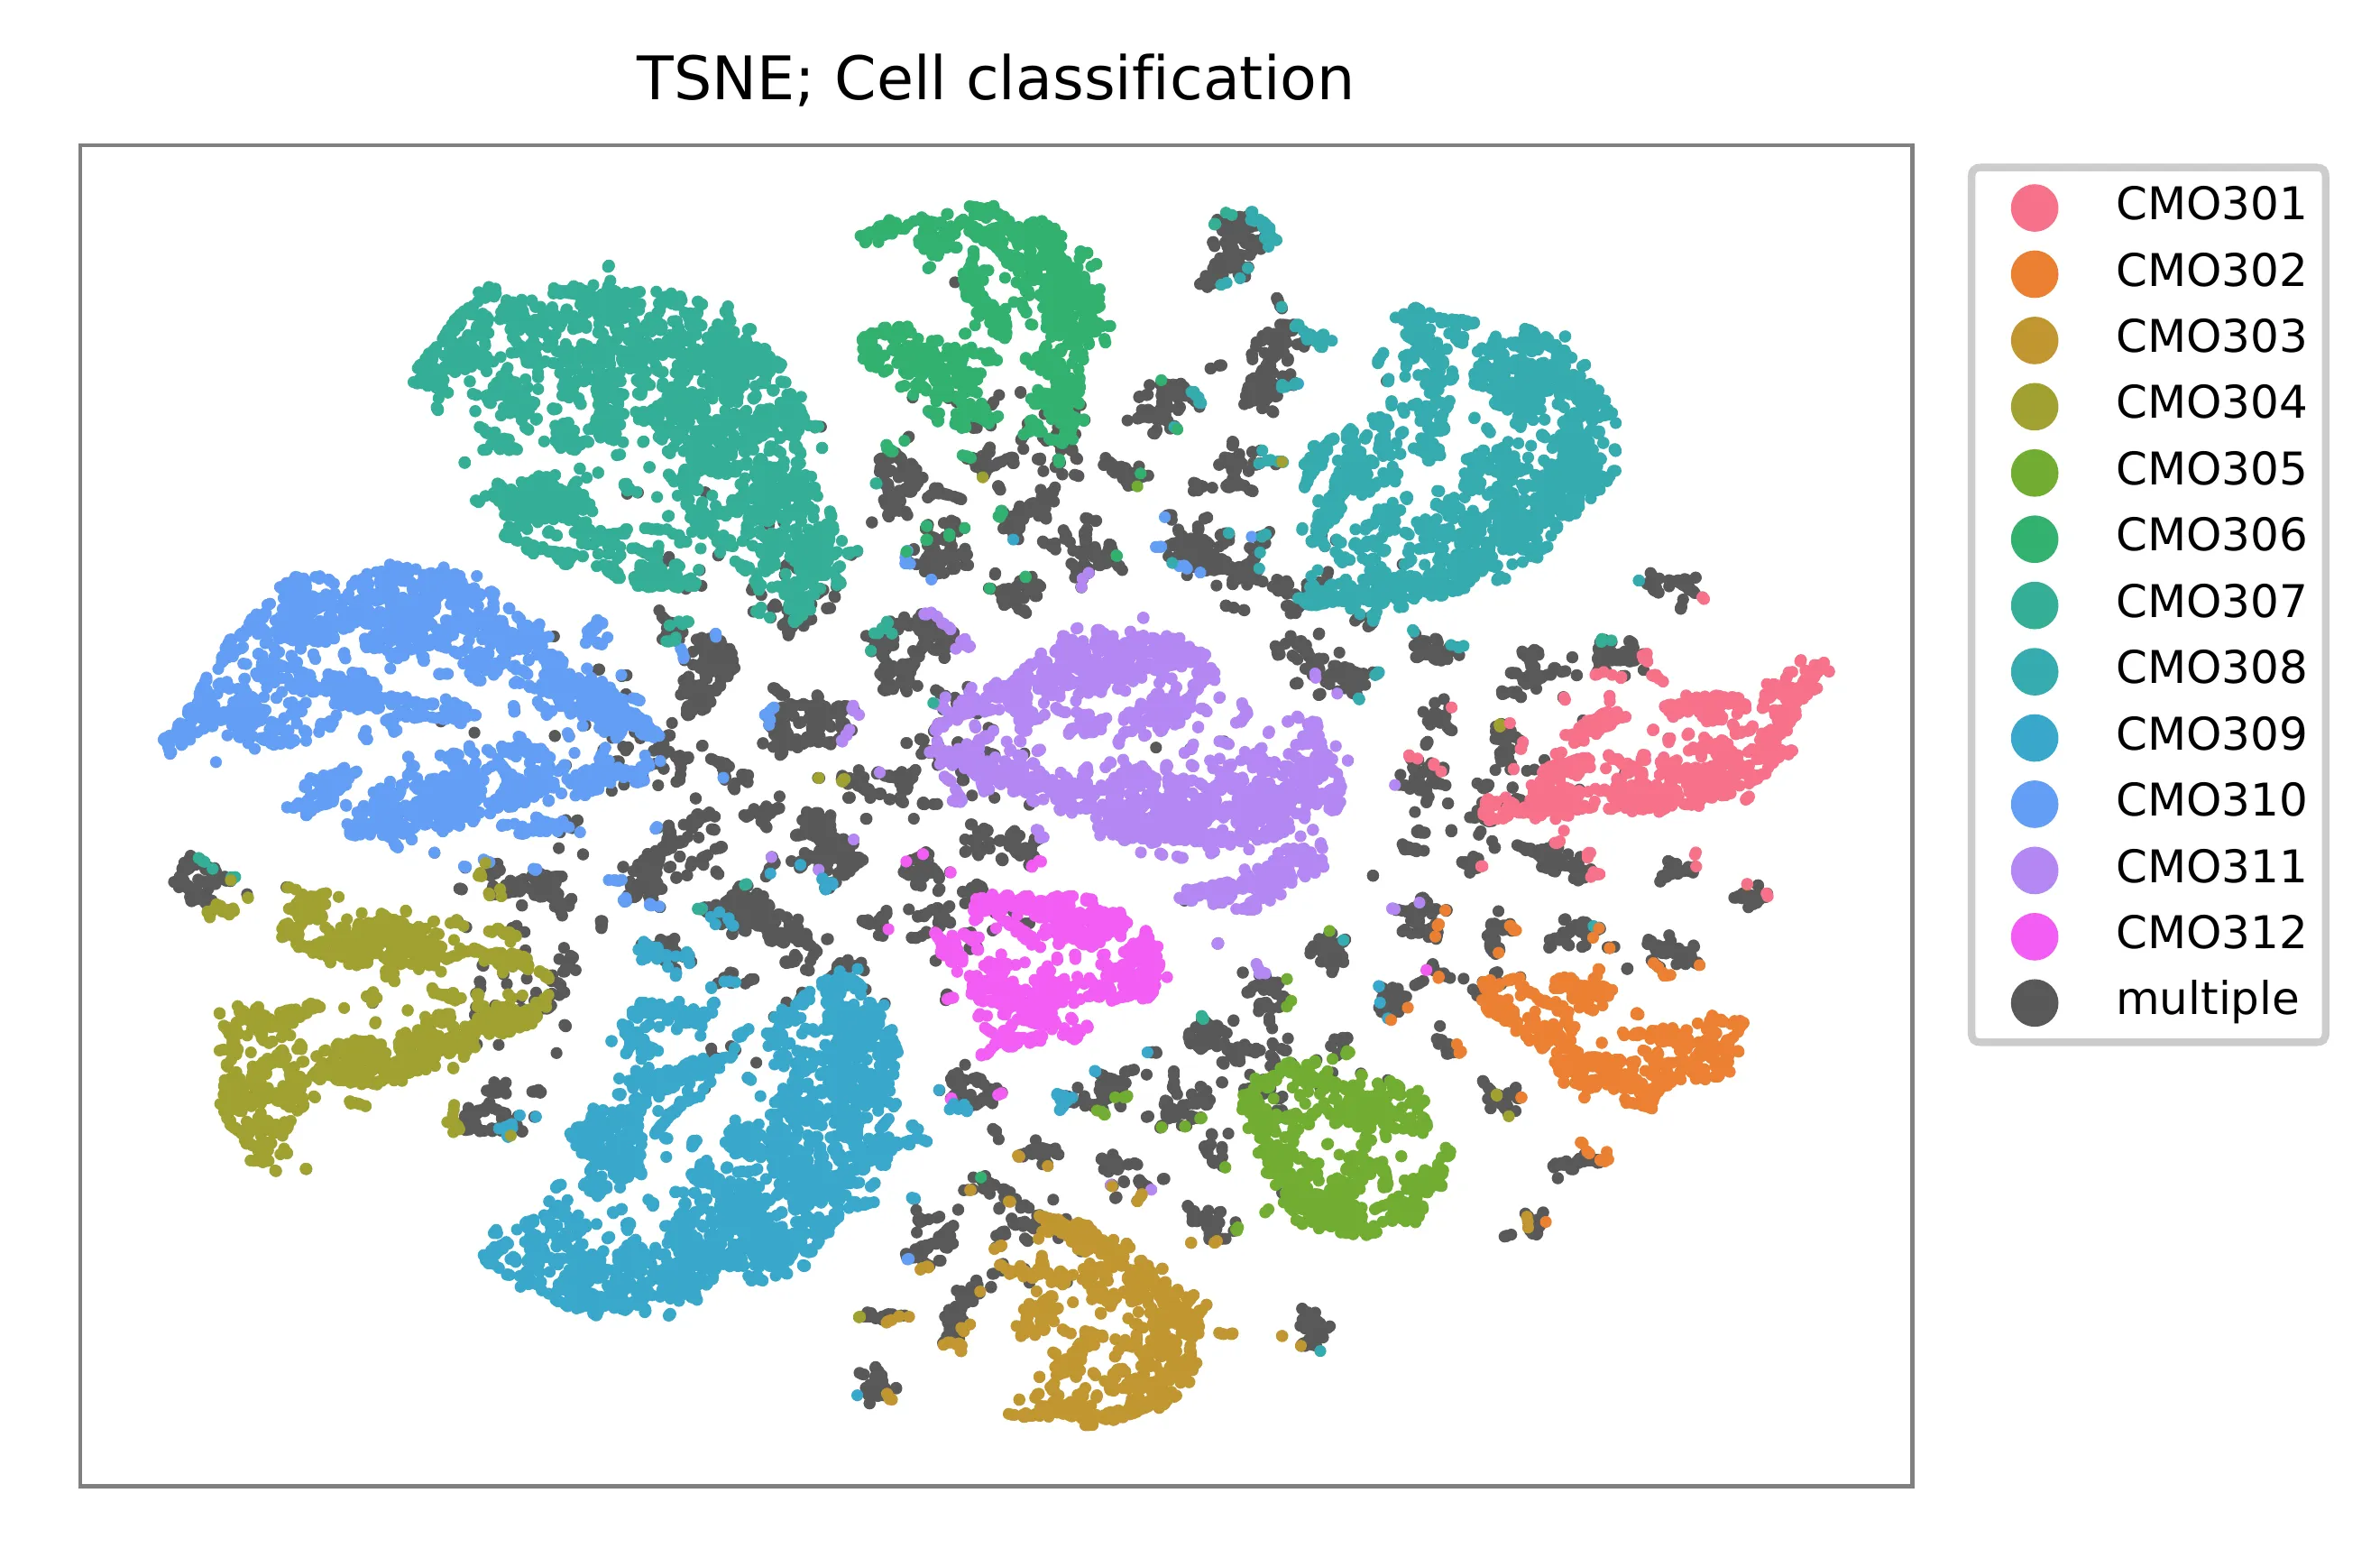
t-SNE embedding of cells based on the abundance of features (CMOs, no transcriptome information used). Colors indicate the CMO status for each cell, as called by FBA. Twelve singlet clusters and cross-oligo multiplet clusters are clearly present.
Preview the demultiplexing result: the numbers of singlets.
In [1]: import pandas as pd

In [2]: m = pd.read_csv("demultiplexed/matrix_cell_identity.csv.gz", index_col=0)

In [3]: m.loc[:, m.sum(axis=0) == 1].sum(axis=1)
Out[3]:
CMO301    1078
CMO302     824
CMO303    1085
CMO304    1575
CMO305     959
CMO306    1362
CMO307    2912
CMO308    2144
CMO309    2841
CMO310    2675
CMO311    2292
CMO312     951
dtype: int64
Kernel density estimation
Cells are demulitplexed based on the feature count matrix (CMO
abundance) using demultiplexing method 4, which is implemented with
modifications to the method described in McGinnis, C., et al. (2019).
A cell identity matrix is generated in the output directory: 0 means
negative, 1 means positive. To generate visualization plots, set -v.
$ fba demultiplex \
    -i matrix_featurecount.csv.gz \
    -dm 4 \
    -v
2021-12-27 12:03:15,693 - fba.__main__ - INFO - fba version: 0.0.x
2021-12-27 12:03:15,693 - fba.__main__ - INFO - Initiating logging ...
2021-12-27 12:03:15,693 - fba.__main__ - INFO - Python version: 3.9
2021-12-27 12:03:15,693 - fba.__main__ - INFO - Using demultiplex subcommand ...
2021-12-27 12:03:18,145 - fba.__main__ - INFO - Skipping arguments: "-q/--quantile", "-cm/--clustering_method", "-p/--prob"
2021-12-27 12:03:18,145 - fba.demultiplex - INFO - Output directory: demultiplexed
2021-12-27 12:03:18,145 - fba.demultiplex - INFO - Demultiplexing method: 4
2021-12-27 12:03:18,145 - fba.demultiplex - INFO - UMI normalization method: clr
2021-12-27 12:03:18,145 - fba.demultiplex - INFO - Visualization: On
2021-12-27 12:03:18,145 - fba.demultiplex - INFO - Visualization method: tsne
2021-12-27 12:03:18,145 - fba.demultiplex - INFO - Loading feature count matrix: matrix_featurecount.csv.gz ...
2021-12-27 12:03:18,453 - fba.demultiplex - INFO - Number of cells: 31,171
2021-12-27 12:03:18,453 - fba.demultiplex - INFO - Number of positive cells for a feature to be included: 200
2021-12-27 12:03:18,499 - fba.demultiplex - INFO - Number of features: 12 / 12 (after filtering / original in the matrix)
2021-12-27 12:03:18,499 - fba.demultiplex - INFO - Features: CMO301 CMO302 CMO303 CMO304 CMO305 CMO306 CMO307 CMO308 CMO309 CMO310 CMO311 CMO312
2021-12-27 12:03:18,499 - fba.demultiplex - INFO - Total UMIs: 713,913,321 / 713,913,321
2021-12-27 12:03:18,523 - fba.demultiplex - INFO - Median number of UMIs per cell: 22,962.0 / 22,962.0
2021-12-27 12:03:18,523 - fba.demultiplex - INFO - Demultiplexing ...
2021-12-27 12:03:39,128 - fba.demultiplex - INFO - Quantile cutoff: 49
2021-12-27 12:03:51,501 - fba.demultiplex - INFO - Generating heatmap ...
2021-12-27 12:04:07,664 - fba.demultiplex - INFO - Embedding ...
2021-12-27 12:04:56,977 - fba.__main__ - INFO - Done.
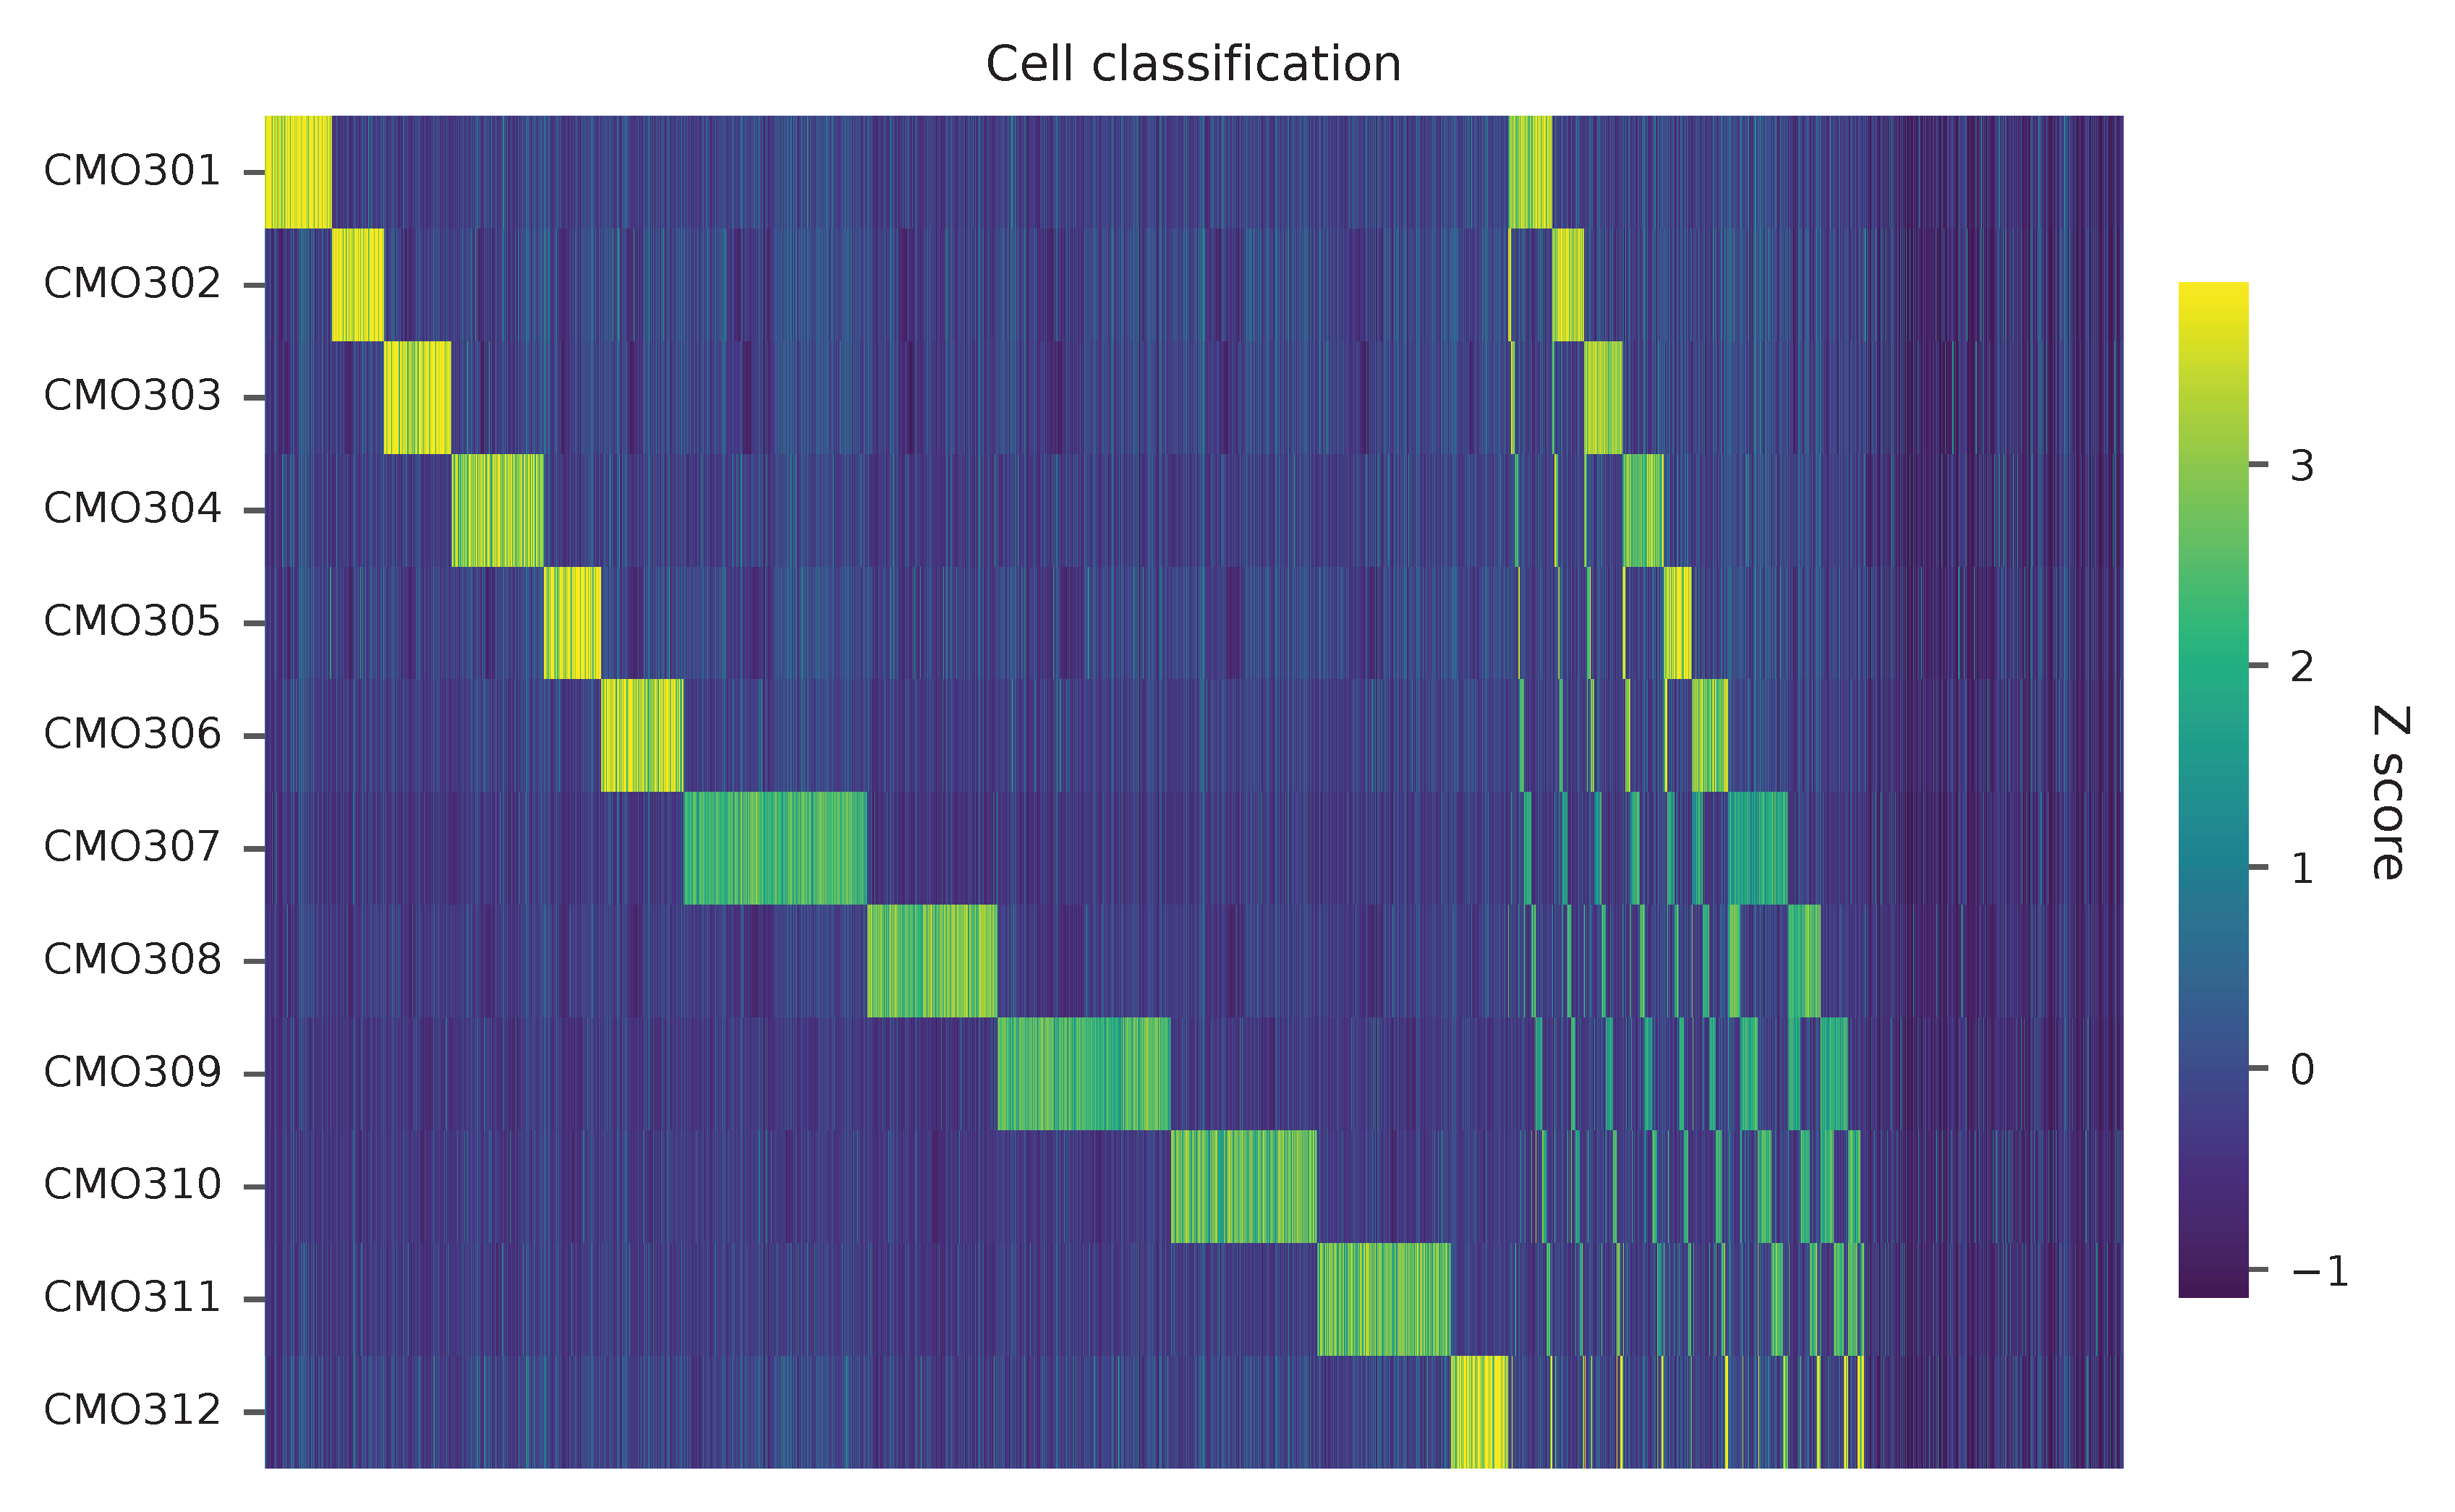
Heatmap of relative abundance of feature across all cells. Each column represents a single cell.
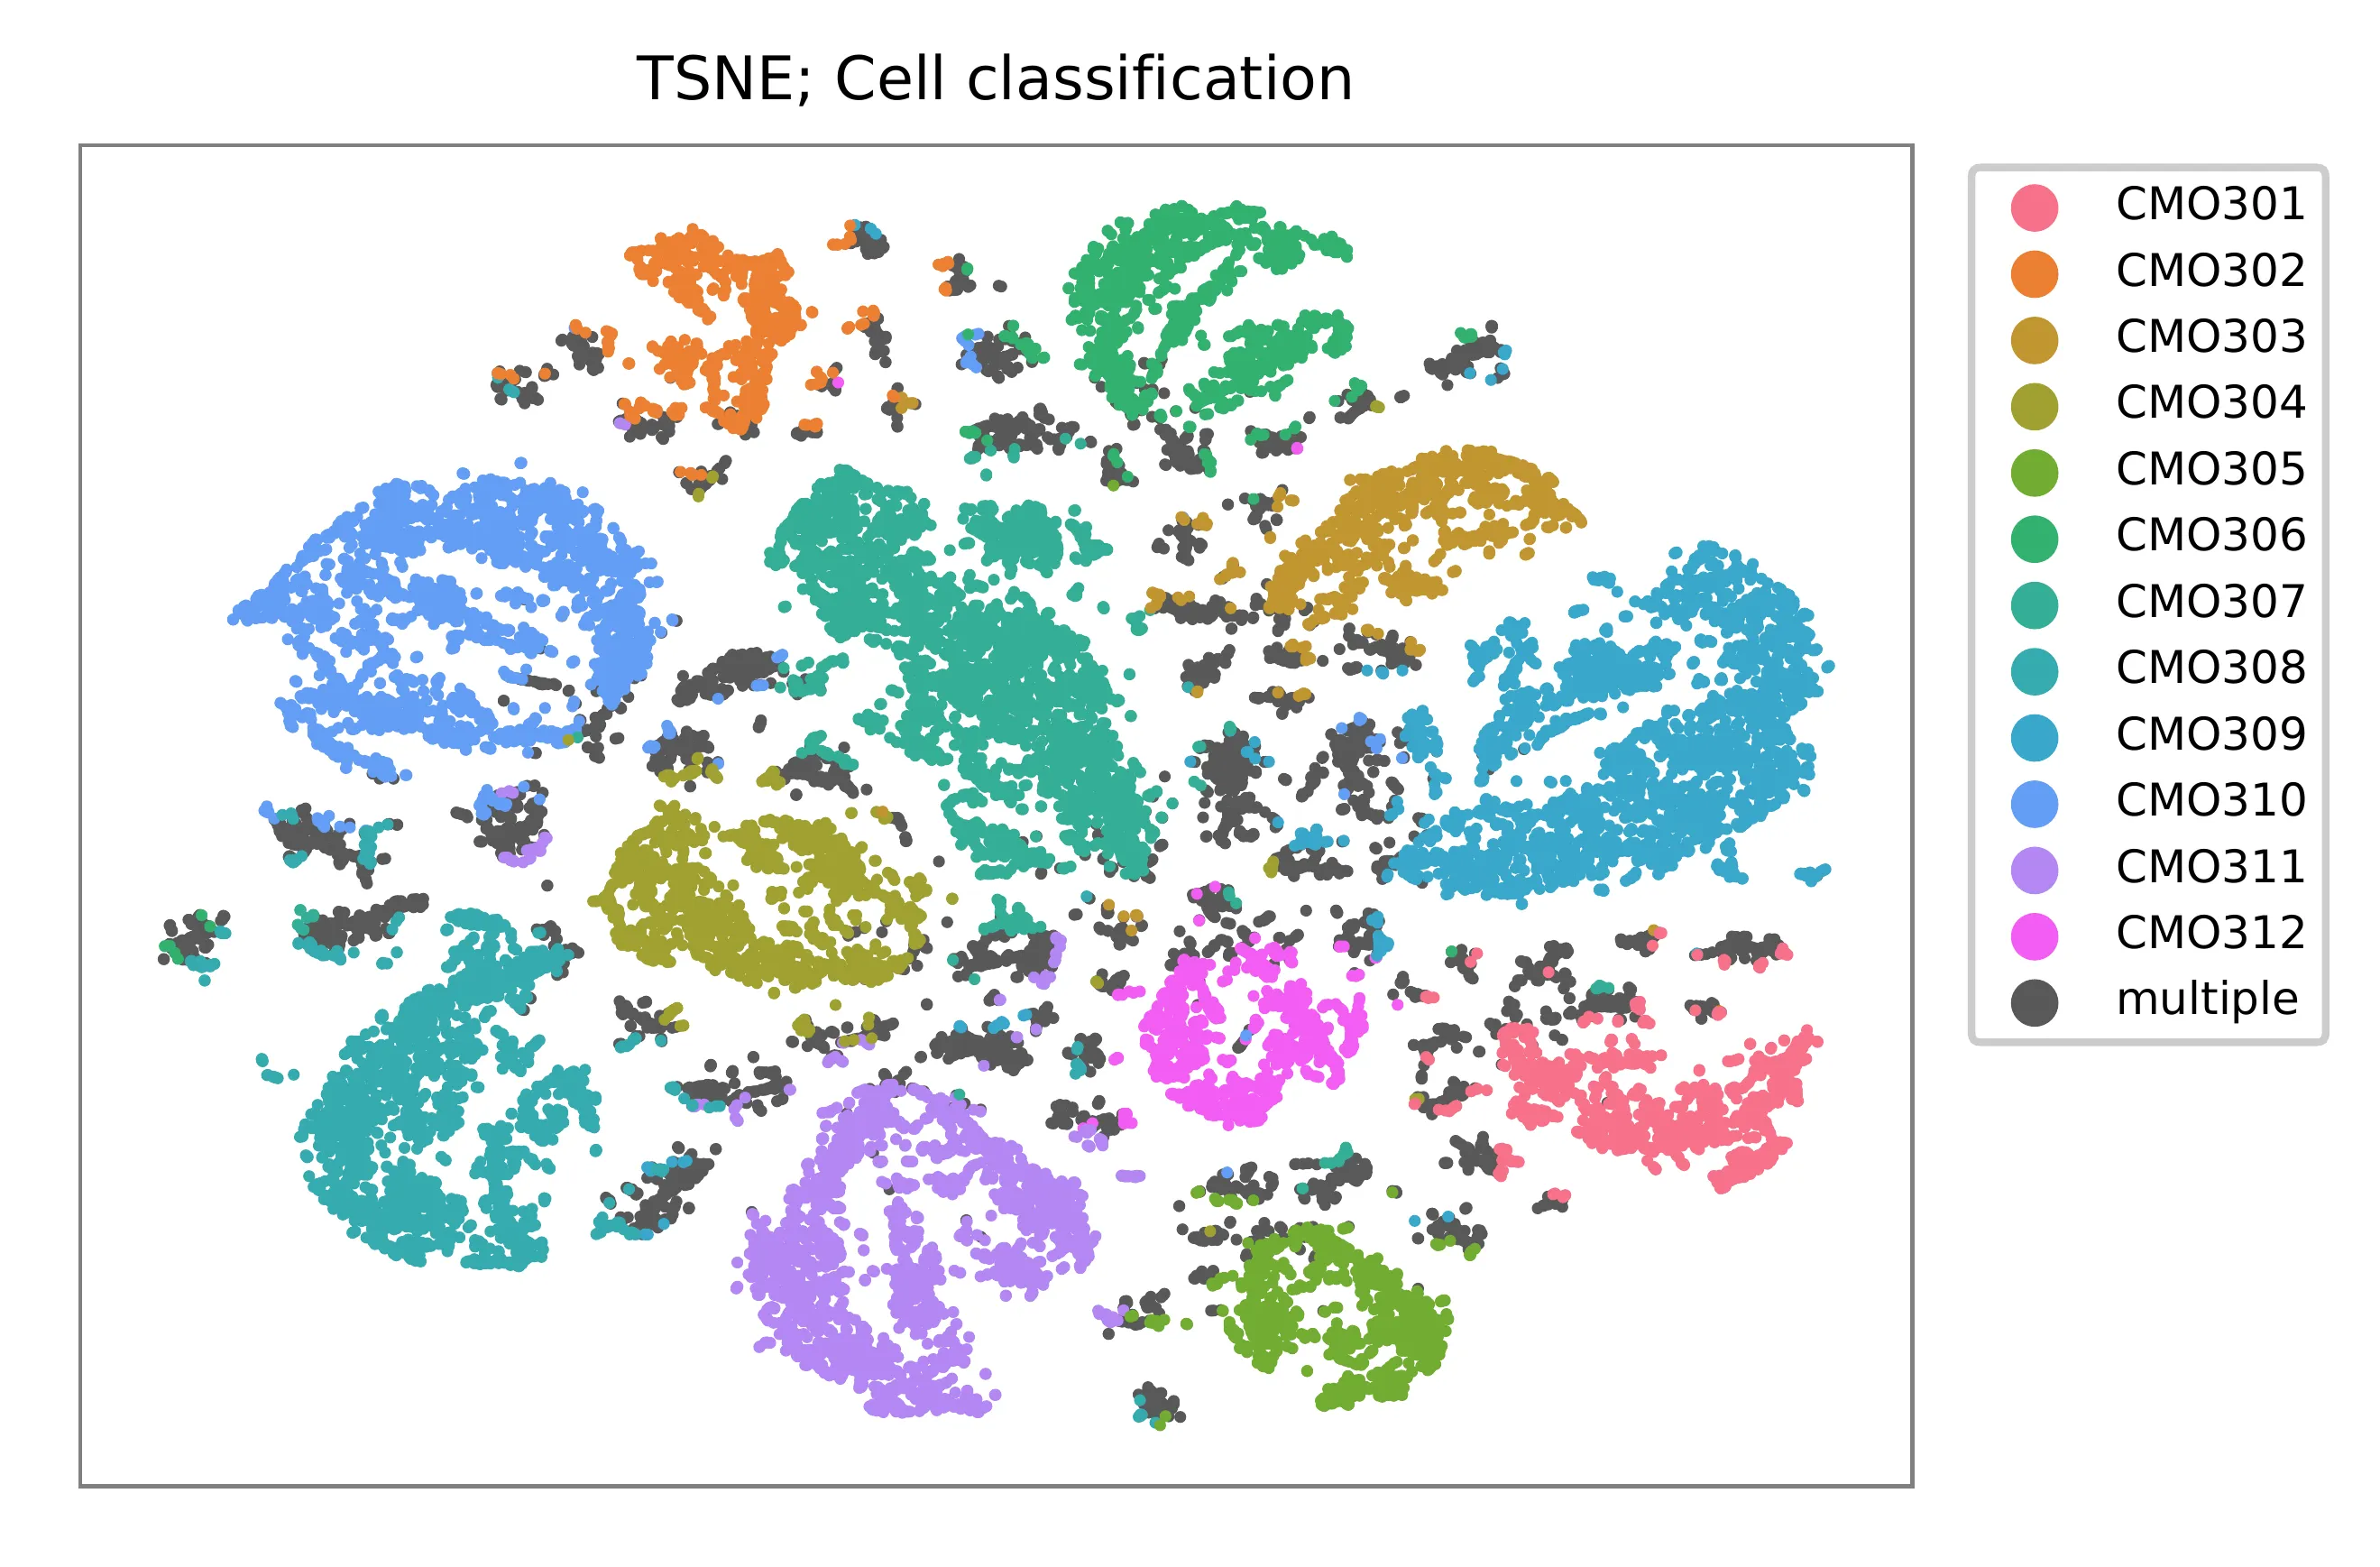
t-SNE embedding of cells based on the abundance of features (no transcriptome information used). Colors indicate the sgRNA status for each cell, as called by FBA.
Preview the demultiplexing result: the numbers of singlets.
In [1]: import pandas as pd

In [2]: m = pd.read_csv("demultiplexed/matrix_cell_identity.csv.gz", index_col=0)

In [3]: m.loc[:, m.sum(axis=0) == 1].sum(axis=1)
Out[3]:
CMO301    1127
CMO302     872
CMO303    1124
CMO304    1562
CMO305     950
CMO306    1386
CMO307    3085
CMO308    2187
CMO309    2914
CMO310    2452
CMO311    2248
CMO312     950
dtype: int64