15k HEK293 and 40k HMECs Multiplexed by Lipid- and Cholesterol-tagged Indices
Dataset: MULTI-seq: sample multiplexing for single-cell RNA sequencing using lipid-tagged indices
McGinnis, C.S., Patterson, D.M., Winkler, J., Conrad, D.N., Hein, M.Y., Srivastava, V., Hu, J.L., Murrow, L.M., Weissman, J.S., Werb, Z., et al. (2019). MULTI-seq: sample multiplexing for single-cell RNA sequencing using lipid-tagged indices. Nat. Methods 16, 619–626.
Preparation
Download pre-processed feature count matrix files from Gene Expression Omnibus.
$ wget https://ftp.ncbi.nlm.nih.gov/geo/series/GSE129nnn/GSE129578/suppl/GSE129578_processed_data_files.csv.tar.gz

$ tar zxvf GSE129578_processed_data_files.csv.tar.gz

$ ls -1

GSE129578_processed_data_files.csv.tar.gz
HMEC_orig_MULTI_matrix.csv
HMEC_techrep_MULTI_matrix.csv
PDX_MULTI_matrix.csv
POC_MULTI_matrix.csv
POC_nuc_MULTI_matrix.csv
15k human embryonic kidney 293 cells (HEK293)
Pre-processing
Inspect feature count matrix.
$ head POC_MULTI_matrix.csv

CellID,LaneID,Bar1,Bar2,Bar3,nUMI_Bar
AAACCTGAGAAGGTTT-1,LMO,1,35,0,36
AAACCTGAGATGTTAG-1,LMO,3,1,4,8
AAACCTGAGGAATGGA-1,LMO,257,0,0,257
AAACCTGAGGGATCTG-1,LMO,2,0,1,3
AAACCTGAGGTAAACT-1,LMO,98,0,0,98
AAACCTGAGTGTTAGA-1,LMO,87,0,0,87
AAACCTGCACACAGAG-1,LMO,114,1,2,117
AAACCTGCACAGCCCA-1,LMO,1,1,25,27
AAACCTGCATCCAACA-1,LMO,4,8,0,12
Pre-process feature count matrix.
In [1]: import numpy as np

In [2]: import pandas as pd

In [3]: m = pd.read_csv(filepath_or_buffer="POC_MULTI_matrix.csv",
                        index_col=0)

In [4]: m.iloc[1:5, 1:5]
Out[4]:
                    Bar1  Bar2  Bar3  nUMI_Bar
CellID
AAACCTGAGATGTTAG-1     3     1     4         8
AAACCTGAGGAATGGA-1   257     0     0       257
AAACCTGAGGGATCTG-1     2     0     1         3
AAACCTGAGGTAAACT-1    98     0     0        98

In [5]: m = m.T.drop(["LaneID", "nUMI_Bar"])

In [6]: m.to_csv(path_or_buf="matrix_featurecount_POC_MULTI.csv.gz",
                 compression="infer")

In [7]: m.sum(axis=0)
Out[7]:
CellID
AAACCTGAGAAGGTTT-1     36
AAACCTGAGATGTTAG-1      8
AAACCTGAGGAATGGA-1    257
AAACCTGAGGGATCTG-1      3
AAACCTGAGGTAAACT-1     98
                    ...
TTTGTCACAAGCCTAT-3      0
TTTGTCAGTATAGTAG-3      0
TTTGTCAGTCTGATCA-3      0
TTTGTCAGTGCGCTTG-3      0
TTTGTCAGTGGTCCGT-3      0
Length: 15482, dtype: object

In [8]: np.median(m.sum(axis=0))
Out[8]: 20.0
Demultiplexing
Cells are demultiplexed based on the abundance of features.
Demultiplexing method 4 is implemented based on the method described
in McGinnis, C., et al. (2019) with some modifications. A
cell identity matrix is generated in the output directory: 0 means
negative, 1 means positive. To generate visualization plots, set -v.
$ fba demultiplex -i matrix_featurecount_POC_MULTI.csv.gz -dm 4 -v

2021-12-20 14:54:45,248 - fba.__main__ - INFO - fba version: 0.0.x
2021-12-20 14:54:45,248 - fba.__main__ - INFO - Initiating logging ...
2021-12-20 14:54:45,248 - fba.__main__ - INFO - Python version: 3.9
2021-12-20 14:54:45,249 - fba.__main__ - INFO - Using demultiplex subcommand ...
2021-12-20 14:54:47,474 - fba.__main__ - INFO - Skipping arguments: "-q/--quantile", "-cm/--clustering_method", "-p/--prob"
2021-12-20 14:54:47,474 - fba.demultiplex - INFO - Output directory: demultiplexed
2021-12-20 14:54:47,474 - fba.demultiplex - INFO - Demultiplexing method: 4
2021-12-20 14:54:47,474 - fba.demultiplex - INFO - UMI normalization method: clr
2021-12-20 14:54:47,474 - fba.demultiplex - INFO - Visualization: On
2021-12-20 14:54:47,474 - fba.demultiplex - INFO - Visualization method: tsne
2021-12-20 14:54:47,474 - fba.demultiplex - INFO - Loading feature count matrix: matrix_featurecount_POC_MULTI.csv.gz ...
2021-12-20 14:54:48,677 - fba.demultiplex - INFO - Number of cells: 15,482
2021-12-20 14:54:48,677 - fba.demultiplex - INFO - Number of positive cells for a feature to be included: 200
2021-12-20 14:54:48,701 - fba.demultiplex - INFO - Number of features: 3 / 3 (after filtering / original in the matrix)
2021-12-20 14:54:48,701 - fba.demultiplex - INFO - Features: Bar1 Bar2 Bar3
2021-12-20 14:54:48,701 - fba.demultiplex - INFO - Total UMIs: 705,913 / 705,913
2021-12-20 14:54:48,713 - fba.demultiplex - INFO - Median number of UMIs per cell: 20.0 / 20.0
2021-12-20 14:54:48,713 - fba.demultiplex - INFO - Demultiplexing ...
2021-12-20 14:54:52,347 - fba.demultiplex - INFO - Generating heatmap ...
2021-12-20 14:54:54,168 - fba.demultiplex - INFO - Embedding ...
2021-12-20 14:55:12,277 - fba.__main__ - INFO - Done.
Heatmap of the relative abundance of features across all cells. Each column represents a single cell.

Preview the demultiplexing result: the numbers of singlets, multiplets and negative cells.
In [1]:  import pandas as pd

In [2]: m = pd.read_csv("demultiplexed/matrix_cell_identity.csv.gz", index_col=0)

In [3]: m.loc[:, m.sum(axis=0) == 1].sum(axis=1)
Out[3]:
Bar1    5909
Bar2    2016
Bar3    2083
dtype: int64

In [4]: sum(m.sum(axis=0) > 1)
Out[4]: 875

In [5]: sum(m.sum(axis=0) == 0)
Out[5]: 4599
40k primary human mammary epithelial cells (HMECs)
Pre-processing
Inspect feature count matrix.
$ head HMEC_orig_MULTI_matrix.csv

CellID,Bar1,Bar2,Bar3,Bar4,Bar5,Bar6,Bar7,Bar8,Bar9,Bar10,Bar11,Bar13,Bar15,Bar18,Bar20,Bar22,Bar23,Bar24,Bar25,Bar27,Bar28,Bar29,Bar31,Bar32,Bar33,Bar34,Bar35,Bar36,Bar37,Bar39,Bar40,Bar41,Bar42,Bar43,Bar44,Bar45,Bar46,Bar47,Bar48,Bar49,Bar51,Bar53,Bar54,Bar55,Bar58,Bar59,Bar60,Bar61,Bar63,Bar65,Bar66,Bar67,Bar69,Bar70,Bar71,Bar72,Bar73,Bar75,Bar76,Bar77,Bar78,Bar80,Bar81,Bar82,Bar83,Bar84,Bar85,Bar88,Bar89,Bar90,Bar91,Bar92,Bar93,Bar94,Bar95,Bar96,nUMI_Bar
AAACCTGAGAAACGAG-1,1,3,5,23,1,3,0,1,6,11,4,4655,7,2,1,3,6,4,0,1,4,4,0,2,3,3,2,0,2,6,4,3,1,0,2,3,5,5,4,0,3,2,1,0,0,2,1,1,1,0,2,0,7,7,2,2,3,2,15,35,0,0,3,9,4,1,3,3,1,1,0,0,2,0,2,0,4907
AAACCTGAGAATGTGT-1,1,1,2,12,3,4,0,0,6,6,7,2,5,2,0,4,198,2,4,9,11,6,0,1,2,4,2,0,1,0,4,0,0,0,0,2,6,0,2,1,8,2,0,0,0,0,0,1,0,89,14,0,2,41,1,2,2,3,6,3,4,0,3,3,1,1,0,3,0,0,1,0,1,8,1,2,539
AAACCTGAGACCCACC-1,0,0,4,6,2,2,8,0,2,5,1,0,6,1,0,4,492,2,0,1,2,3,1,1,2,0,3,0,1,0,2,2,0,1,1,1,3,2,1,0,1,1,0,0,0,2,0,2,0,0,1,0,0,0,1,2,0,0,1,1,0,0,2,3,0,1,0,0,76,0,1,1,0,1,3,3,671
AAACCTGAGGAACTGC-1,1,0,3,7,4,5,2,0,5,5,5,1,2,1,2,2550,3,4,0,4,5,62,1,4,6,2,4,1,2,0,6,37,8,0,2,1,34,2,1,0,3,1,0,0,0,1,1,0,2,4,3,0,3,0,5,0,3,12,4,3,3,0,4,5,4,0,2,1,2,11,1,0,3,0,2,0,2866
AAACCTGCAACTGGCC-1,0,1,3,3,4,5,0,1,1,11,4,1,6,1,3,25,8,1,1,8,6,9,2,6,2,3,2,1,1,4,3,1,4,1,6,1,29,4,9,0,7,21,1,0,0,2,1,1,3,1,1,2,2,5,5,26,6,3,13,15,4,2,3,4,18,1,0,2,1,3,0,1,4,20,1,0,372
AAACCTGCAGATTGCT-1,1,0,2,5,2,4,1,1,8,6,4,0,4,0,1,7,2,4,0,2,1,8,0,0,15,3,2,4,1,2,3,3,1,2,0,3,3,14,3,0,2,3,0,0,0,0,2,515,0,2,2,0,1,1,2,2,3,3,5,0,1,2,1,3,11,0,3,3,0,0,0,1,1,0,4,3,715
AAACCTGCAGGGCATA-1,0,4,11,10,3,4,4,2,4,23,4,2,11,3,1,17,6,4,8,7,6,16,2,3,23,4,6,5,3,8,4,4,5,2,10,7,29,3,3,0,4,2,3,0,0,1,0,7,0,3,2,2,1,6,6,0,0,9,12,7,2398,3,6,6,9,6,1,8,9,4,1,758,4,8,7,0,3570
AAACCTGCATACGCCG-1,0,2,2,11,1,2,1,0,6,7,1,0,3,1655,1,3,1,3,2,10,7,5,0,0,1,1,2,0,1,1,4,1,10,0,0,2,4,2,0,0,0,0,2,1,1,1,1,0,0,5,0,2,4,0,7,1,4,1,4,2,3,2,1,2,3,1,2,6,2,2,0,1,1,59,3,0,1910
AAACCTGCATCACAAC-1,0,1,10,4,1,7,0,0,3,5,0,1,2,1,207,10,5,2,3,3,8,3,1,1,3,1,4,2,4,0,1,1,5,0,1,0,5,3,12,0,3,0,1,1,2,1,1,3,2,2,0,0,0,1,0,1,2,3,6,2,4,0,1,6,2,1,3,1,4,0,1,1,6,4,2,0,390
Pre-process feature count matrix.
In [1]: import numpy as np

In [2]: import pandas as pd

In [3]: m = pd.read_csv(filepath_or_buffer="HMEC_orig_MULTI_matrix.csv",
                        index_col=0)

In [4]: m = m.T.drop(['nUMI_Bar'])

In [5]: m.to_csv(path_or_buf="matrix_featurecount_HMEC_MULTI.csv.gz", compression="infer")

In [6]: m.sum(axis=0)
Out[6]:
CellID
AAACCTGAGAAACGAG-1     4905
AAACCTGAGAATGTGT-1      512
AAACCTGAGACCCACC-1      665
AAACCTGAGGAACTGC-1     2865
AAACCTGCAACTGGCC-1      360
                    ...
TTTGTCATCGAATGGG-3     3436
TTTGTCATCGGAGCAA-3      662
TTTGTCATCGGATGTT-3      152
TTTGTCATCTGATTCT-3    27223
TTTGTCATCTGCCAGG-3      256
Length: 40009, dtype: int64

In [7]: np.median(m.sum(axis=0))
Out[7]: 1241.0

In [8]: m.shape
Out[8]: (76, 40009)
Demultiplexing
Cells are demultiplexed based on the abundance of features.
Demultiplexing method 4 is implemented based on the method described
in McGinnis, C., et al. (2019) with some modifications. A
cell identity matrix is generated in the output directory: 0 means
negative, 1 means positive. To generate visualization plots, set -v.
$ fba demultiplex -i matrix_featurecount_HMEC_MULTI.csv.gz -dm 4 -v

2021-12-20 16:31:12,889 - fba.__main__ - INFO - fba version: 0.0.x
2021-12-20 16:31:12,889 - fba.__main__ - INFO - Initiating logging ...
2021-12-20 16:31:12,889 - fba.__main__ - INFO - Python version: 3.9
2021-12-20 16:31:12,889 - fba.__main__ - INFO - Using demultiplex subcommand ...
2021-12-20 16:31:15,503 - fba.__main__ - INFO - Skipping arguments: "-q/--quantile", "-cm/--clustering_method", "-p/--prob"
2021-12-20 16:31:15,503 - fba.demultiplex - INFO - Output directory: demultiplexed
2021-12-20 16:31:15,503 - fba.demultiplex - INFO - Demultiplexing method: 4
2021-12-20 16:31:15,503 - fba.demultiplex - INFO - UMI normalization method: clr
2021-12-20 16:31:15,503 - fba.demultiplex - INFO - Visualization: On
2021-12-20 16:31:15,503 - fba.demultiplex - INFO - Visualization method: tsne
2021-12-20 16:31:15,503 - fba.demultiplex - INFO - Loading feature count matrix: matrix_featurecount_HMEC_MULTI.csv.gz ...
2021-12-20 16:31:23,363 - fba.demultiplex - INFO - Number of cells: 40,009
2021-12-20 16:31:23,363 - fba.demultiplex - INFO - Number of positive cells for a feature to be included: 200
2021-12-20 16:31:23,430 - fba.demultiplex - INFO - Number of features: 76 / 76 (after filtering / original in the matrix)
2021-12-20 16:31:23,430 - fba.demultiplex - INFO - Features: Bar1 Bar2 Bar3 Bar4 Bar5 Bar6 Bar7 Bar8 Bar9 Bar10 Bar11 Bar13 Bar15 Bar18 Bar20 Bar22 Bar23 Bar24 Bar25 Bar27 Bar28 Bar29 Bar31 Bar32 Bar33 Bar34 Bar35 Bar36 Bar37 Bar39 Bar40 Bar41 Bar42 Bar43 Bar44 Bar45 Bar46 Bar47 Bar48 Bar49 Bar51 Bar53 Bar54 Bar55 Bar58 Bar59 Bar60 Bar61 Bar63 Bar65 Bar66 Bar67 Bar69 Bar70 Bar71 Bar72 Bar73 Bar75 Bar76 Bar77 Bar78 Bar80 Bar81 Bar82 Bar83 Bar84 Bar85 Bar88 Bar89 Bar90 Bar91 Bar92 Bar93 Bar94 Bar95 Bar96
2021-12-20 16:31:23,432 - fba.demultiplex - INFO - Total UMIs: 154,135,306 / 154,135,306
2021-12-20 16:31:23,462 - fba.demultiplex - INFO - Median number of UMIs per cell: 1,241.0 / 1,241.0
2021-12-20 16:31:23,462 - fba.demultiplex - INFO - Demultiplexing ...
2021-12-20 16:33:51,278 - fba.demultiplex - INFO - Generating heatmap ...
2021-12-20 16:35:49,956 - fba.demultiplex - INFO - Embedding ...
2021-12-20 16:36:58,791 - fba.__main__ - INFO - Done.
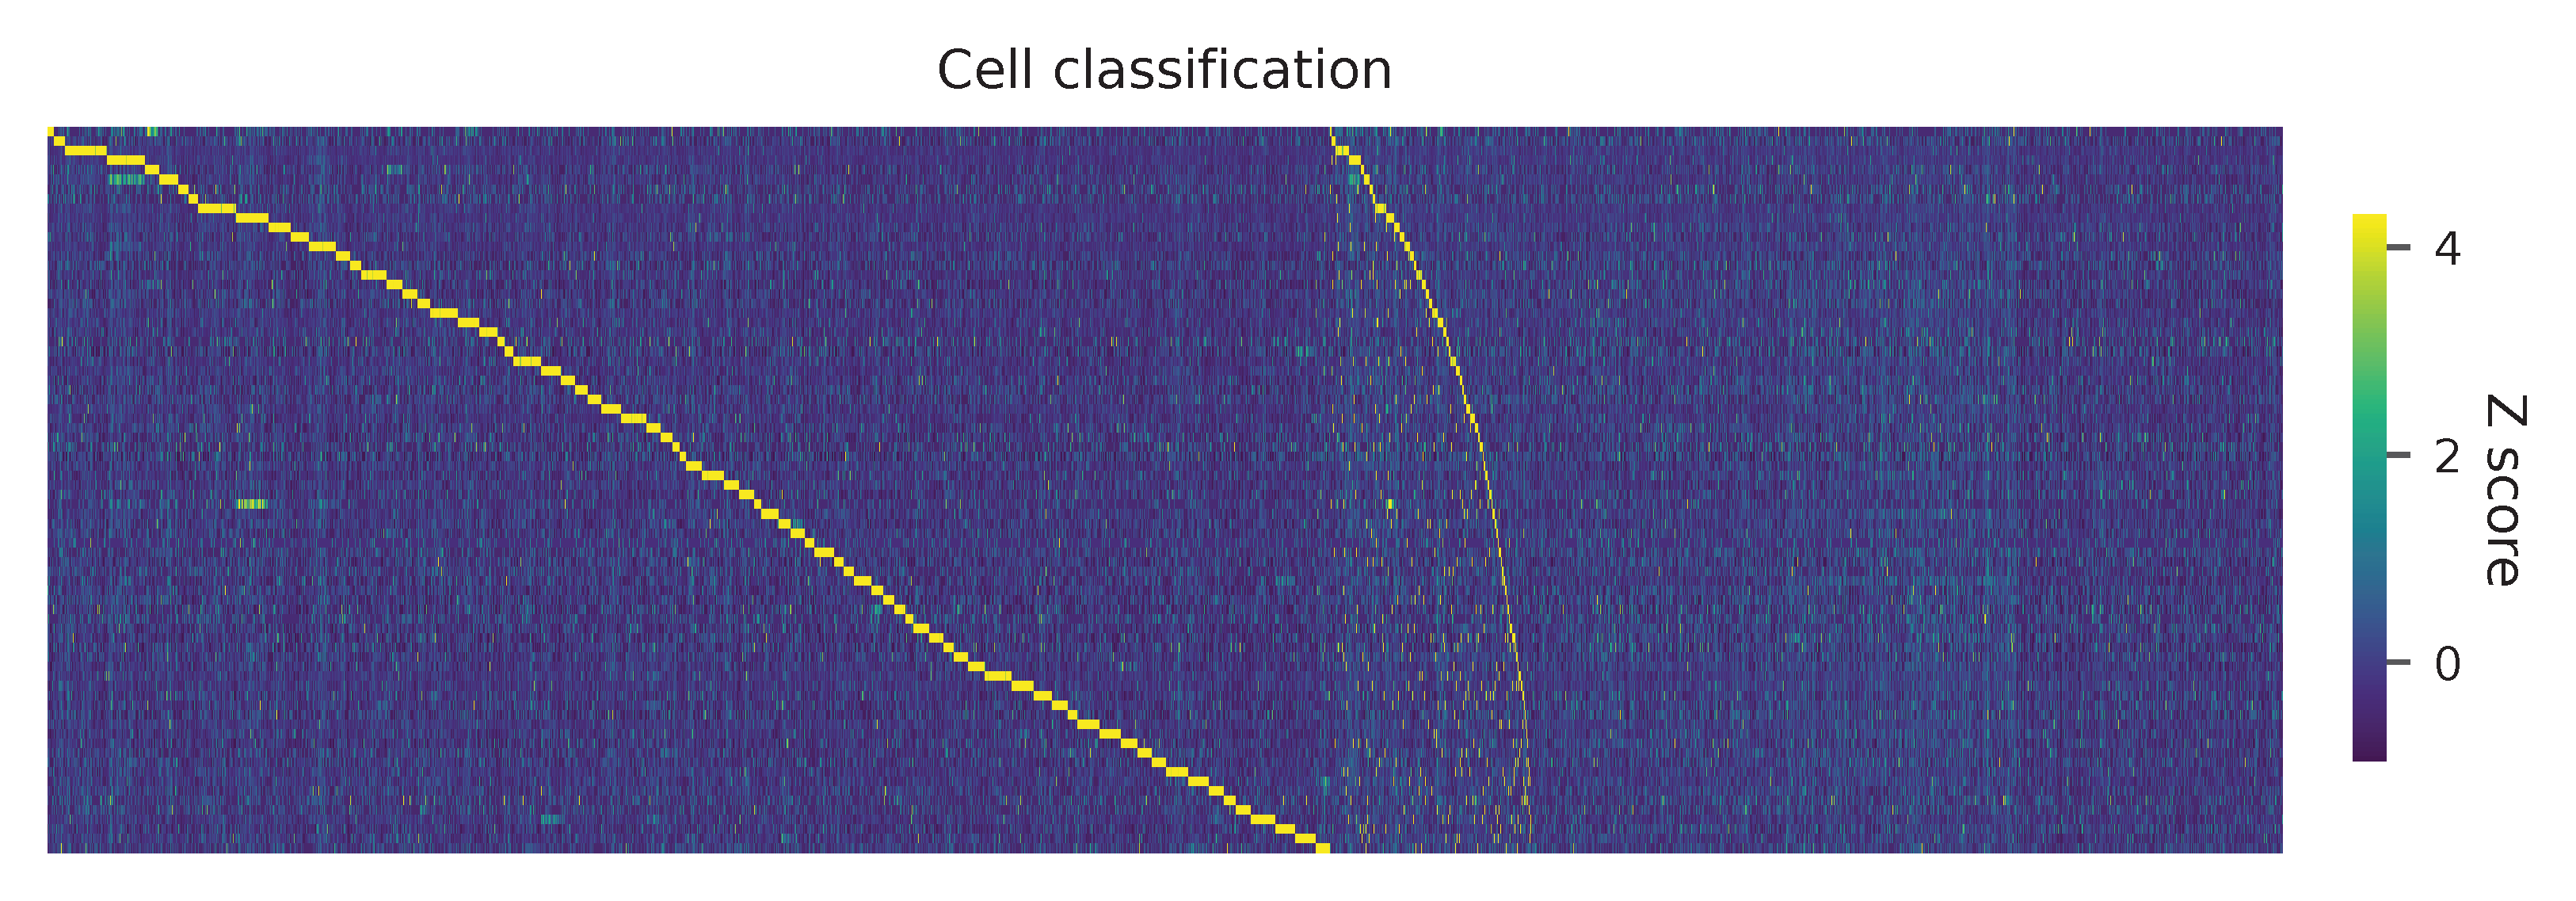
Heatmap of the relative abundance of features across all cells. Each column represents a single cell.
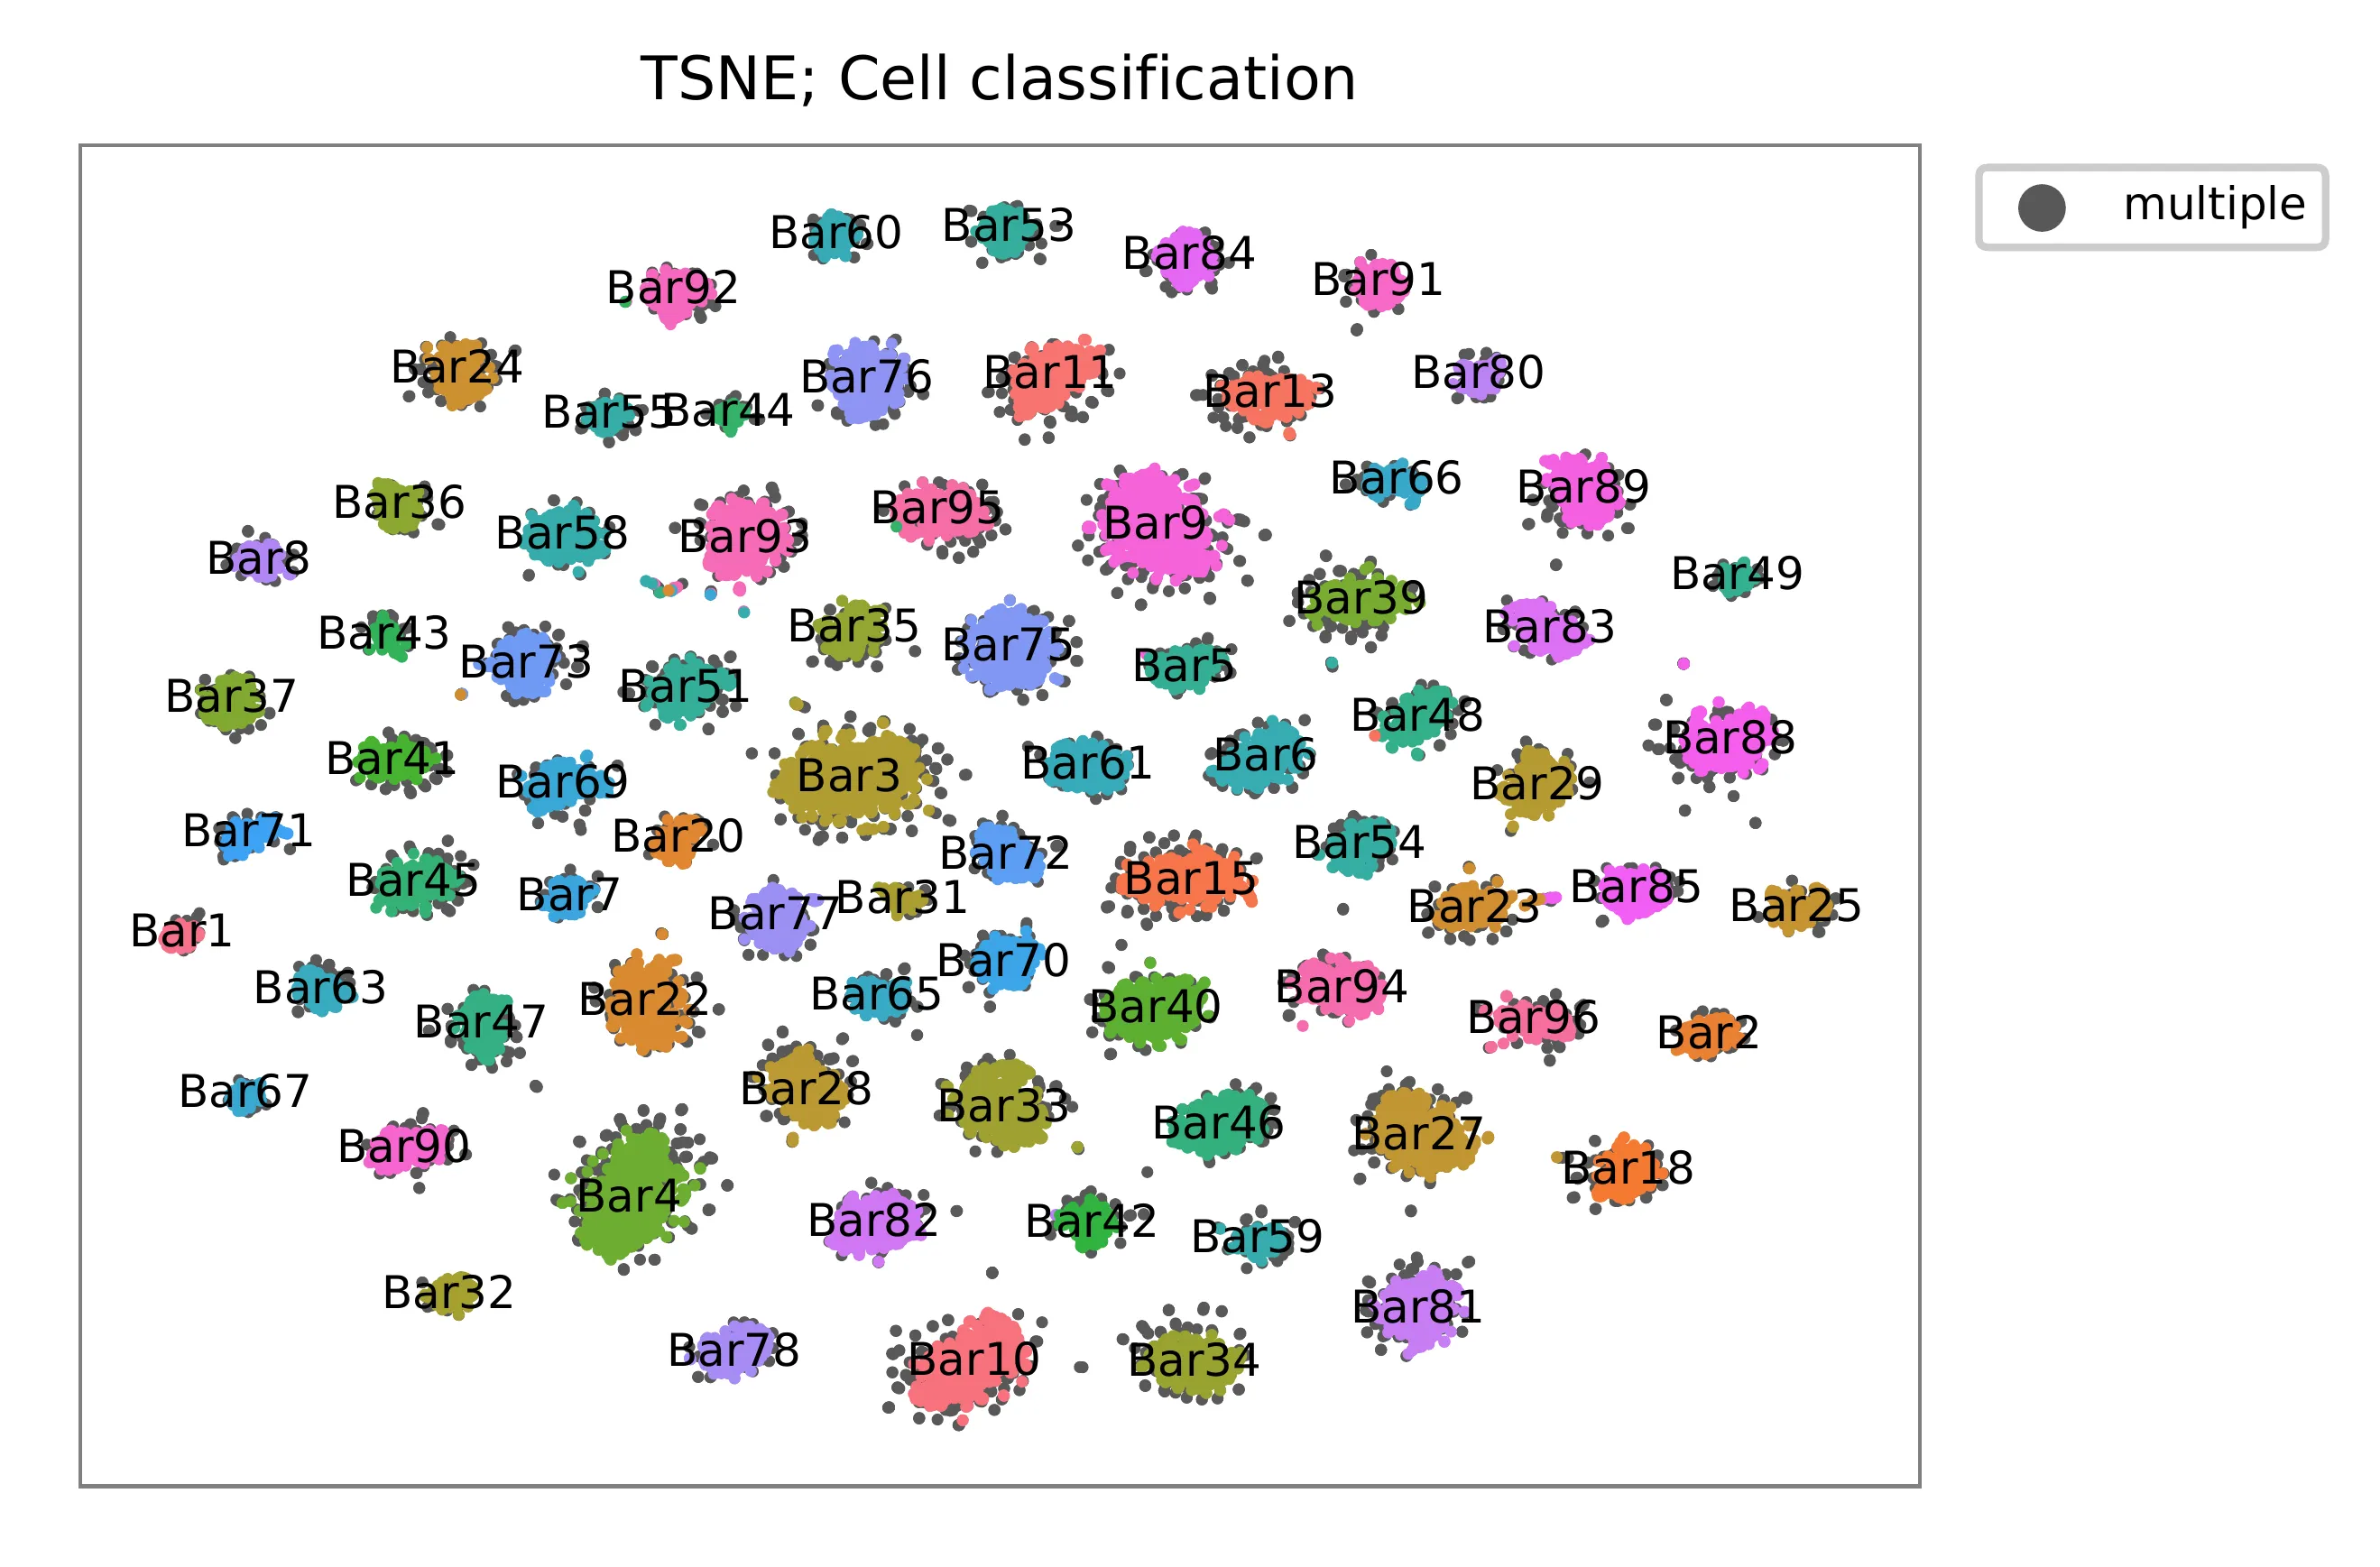
t-SNE embedding of cells based on the abundance of features (no transcriptome information used). Colors indicate the index status for each cell, as called by FBA. This is a re-creation of Fig. 2a in McGinnis, C., et al. (2019).
Preview the demultiplexing result: the numbers of singlets, multiplets and negative cells.
In [1]: import numpy as np

In [2]: import pandas as pd

In [3]: pd.options.display.max_rows = 999

In [4]: m = pd.read_csv("demultiplexed/matrix_cell_identity.csv.gz", index_col=0)

In [5]: m.loc[:, m.sum(axis=0) == 1].sum(axis=1)
Out[5]:
Bar1     121
Bar2     201
Bar3     745
Bar4     681
Bar5     257
Bar6     346
Bar7     181
Bar8     169
Bar9     687
Bar10    572
Bar11    395
Bar13    334
Bar15    472
Bar18    262
Bar20    195
Bar22    456
Bar23    279
Bar24    276
Bar25    226
Bar27    503
Bar28    378
Bar29    324
Bar31    123
Bar32    165
Bar33    488
Bar34    358
Bar35    260
Bar36    222
Bar37    247
Bar39    348
Bar40    453
Bar41    252
Bar42    215
Bar43    134
Bar44    103
Bar45    297
Bar46    391
Bar47    268
Bar48    276
Bar49    122
Bar51    316
Bar53    211
Bar54    254
Bar55    164
Bar58    356
Bar59    172
Bar60    182
Bar61    321
Bar63    202
Bar65    207
Bar66    200
Bar67    130
Bar69    286
Bar70    258
Bar71    184
Bar72    257
Bar73    299
Bar75    478
Bar76    396
Bar77    328
Bar78    286
Bar80    174
Bar81    387
Bar82    391
Bar83    294
Bar84    250
Bar85    263
Bar88    400
Bar89    360
Bar90    277
Bar91    213
Bar92    259
Bar93    452
Bar94    354
Bar95    366
Bar96    255
dtype: int64

In [6]: np.median(m.loc[:, m.sum(axis=0) == 1].sum(axis=1))
Out[6]: 276.0

In [7]: sum(m.sum(axis=0) > 1)
Out[7]: 3597

In [8]: sum(m.sum(axis=0) == 0)
Out[8]: 13448